

")
Publication History
Submitted: March 11, 2025
Accepted: March 28, 2025
Published: March 31, 2025
Identification
D-0415
DOI
https://doi.org/10.71017/djmi.4.3.d-0415
Citation
Edward Agongo (2025). Water, Sanitation and Hygiene Practices of Mothers/Caregivers in Relation to Nutritional Status of Children Under Five Years in the NABDAM District. Dinkum Journal of Medical Innovations, 4(03):104-123.
Copyright
© 2025 The Author(s).
104-123
Water, Sanitation and Hygiene Practices of Mothers/Caregivers in Relation to Nutritional Status of Children Under Five Years in the NABDAM DistrictOriginal Article
Edward Agongo 1*
- Ghana Health Service, Nabdam district in Upper East Region and KNUST, Ghana.
* Correspondence: edwardagongo@gmail.com
Abstract: Malnutrition among children below the ages of five may be blamed for most childhood diseases and stunted growth. One of the major solutions to malnutrition is through effective and efficient childcare in households. This study assessed the water, sanitation and hygiene (WASH) practices among mothers/ caregivers in relation with the nutritional status of children under five years in the NABDAM district of the UER. A community-based analytical cross-sectional study design was used to recruit mother and child pairs to collect quantitative data on WASH practices of mothers/caregiver and nutritional status (Anthropometry) of the children. A total of N=312 respondents were assessed. A total of 314 respondents were involved in the study, 90% of all respondents were female with the majority of them lactating, and 5% pregnant as at the time of data collection. From the study, 94% of respondents were well-nourished, and only 6% were moderately malnourished using MUAC. Stunting prevalence among children (<-2 z-scores) was (57.5%) and (46.9%) for boys and girls respectively. The prevalence of underweight was also 25.7% for boys and 15.2% for girls. The occurrence of diarrhoea is dependent on Handwashing with soap, and handwashing with water only as the chi-square value of 14.5 and 13.1 are all significant at alpha value of 0.05 (p-value < 0.05). The results also show that handwashing after defecation, after handshake and after work are not related to diarrhoea occurrence among under five. However, diarrhoea occurrence is dependent on handwashing before/after eating and after changing babies. In the study, diarrhoea occurrence significantly sets in 6-17 months. Diarrhoea occurrence is high within the lower age group and gradually reduces towards older age groups. However, nutritional status of children had remained significantly high in all age categories. While, severe stunting remained high in all age categories though severe underweight is low from the result of the study.
Keywords: sanitation, hygiene practices, mothers, caregivers, nutritional status
- INTRODUCTION
Early childhood nutrition is integral in the full potential growth and survival of the child. According to the latest Global Nutrition Report, progress to address all forms of malnutrition remains unacceptably slow with less than 50% of countries on track to achieve at least one of the nine global targets on nutrition. Specifically, countries are currently experiencing multiple forms of malnutrition among children [1]. Globally, about 22.9% of children are stunted, which translates to 155 million children suffering from chronic malnutrition [2]. The period from pregnancy to the age of two years of children is very crucial for the optimal growth, health and behavioural development of children. According to [3], malnutrition is defined as a condition caused by eating a diet in which nutrients are not enough or are too much such that it causes health problems. Malnutrition is responsible for nearly half of all deaths in children under 5, thus accounts for the loss of lives of about 3 million children a year. According to [4] stunting and wasting are associated with increased mortality in children. It has also been established that, children who are stunted have a higher chance of becoming wasted and the vice versa [5]. One of the major solutions to malnutrition is through effective and efficient childcare among households. Collectively, malnutrition which contributes to ill health than any other cause can be addressed through good care practices and adequate basic health services [6]. This implies that effective childcare practices targeted at children below five years has the prospects to promote optimum growth of children and thus development. A seminal of studies [7], reveal that good childcare practices include, adequate feeding of children, proper home healthcare, hygienic food preparation and providing a hygienic environment for children at their most vulnerable stages are pivotal to their nutritional and health outcomes. An author [8] has attributed childhood malnutrition to poverty and limited economic resources, nevertheless, seminal studies [9,10], illustrates that most children from developing countries grow and develop normally, and this is attributed to good family and caregivers’ behaviour. Feeding and Health care for the child do not suffice child care practices necessary for healthy growth of the child. However, dietary/nutrient adequacy and immunity against infectious diseases are crucial determinants of a child’s health and physical growth. Also ‘Social gradient’ in terms of sociodemographic status plays a significant role in food security and access to health care. Nonetheless even household and families with poor food security status and with least access to health service are capable of harnessing already existing resource to optimize their health [11]. The role of child care practice in the nutritional and health wellbeing of the child cannot be overemphasized. It is therefore in this light that, the current research focuses on assessing the influence/effect of WASH practices of mothers which is one of the components of care practices on nutritional status of children under five years in the NABDAM district in the Upper East region of Ghana. Global estimates on chronic child malnutrition show that 155 million children are stunted and 40 million are overweight. Furthermore, the World Bank Group eestimates that 52 million children under five years are acutely malnourished. Africa has 59 million of its children being short for their age and West Africa alone is responsible for half of the chronically malnourished children in Africa where about 4 million more stunted children are seen in 2016 compared to 2000 [12]. Progress towards achieving the nutrition related SDGs suggests that malnutrition still remains a problem. Examining the progress of achieving SDG indicators linked to goal 2 revealed that, the world is off course and not even halfway to ending undernourishment, wasting and stunting [13]. One cannot ignore the human consequences if these current trajectories continue. If these trajectories continue, more than 15% of children under five will be stunted and more than 6% will be wasted by 2030 [14]. The problem of malnutrition in Ghana is not much different from the global picture. According to a COHA report, in Ghana, about 37% of adult individuals have been chronically malnourished when they were children. Again, 24% of all mortalities among children is linked to malnutrition which in turn impacts a reduction in workforce productivity by 7.3% [15]. Even though the Upper East Region of Ghana has made significant gains in reducing stunting rates between 2008 and 2014 (from 36% to 14.4% respectively), it cannot boast of the best rates in nutrition indicators in the country therefore leaving much to be desired in terms of nutritional wellbeing of children in the Region as whole [16]. There are varied opinions on the factors accounting for childhood malnutrition and ineffective childcare practices. For instance, [17] argue that poverty and economic resources are the reasons for childhood malnutrition. However, the argument of [18,19] suggests that poverty and economic resources are not the sole factors, but also positive family and child caregivers’ behaviours, attitude and practices. According to [8], the cause of malnutrition ranges from basic causes at the societal level, underlying causes at the household or family level and immediate causes. Furthermore, [20], adds that the causes of child malnutrition include inadequate nutrition education among women at the child-bearing age, poor health care, poor personal and environmental hygiene practices, beliefs and superstition. An author [21] adds further that the few educated women in their child-bearing ages lack confidence to implement and practice appropriate child care practices in the facade of myths and superstition. The WHO holds the view that, inappropriate child feeding practices is a major cause of malnutrition in infants. The arguments of studies conducted by [21,22] among others suggest that the causes of poor childcare practices and child malnutrition ranges from social, cultural and economic dimensions. This study assessed the water, sanitation and hygiene practices of mothers/caregivers in relation to the nutritional status of children under five years in the NABDAM district of the UER.
- MATERIALS & METHOD
A community-based analytical cross-sectional study design was be used by the researcher to achieve the study objectives. Quantitative data collection techniques were used to obtain information from women/care-givers of childbearing age in the study district. A mother/caregiver and a child under five-year-old pair were the study subjects. The study collected data on WASH practices, nutritional status (Anthropometry) of children under five years, and applied appropriate statistical techniques to establish the relationship between the WASH practices and nutritional status of the children. The study was conducted in the NABDAM district of Upper East Region (UER). It is one of the newly created districts carved out of the then Talensi-Nabdam District. It has Nangodi as its District capital. The NABDAM district is located in the Upper East Region of Ghana. It lies between latitudes 100 47ꞌ and 100 57ꞌ north of the Equator; and longitudes 00 31ꞌ and 10 15ꞌ west of the Greenwich Meridian. It is bordered to the North, South and East by the Bongo, Talensi and Bawku West Districts and to the West by Bolgatanga Municipality. The district occupies a land area of 353 km2. The district is further divided into five sub-districts (Nangodi, Pelungu, Kongo/Pitanga, Sakoti and Zanlerigu). The district has 8 health facilities serving a population of 33,826 People living in 5,966 households [23]. The vegetation is guinea savannah woodland consisting of short widely spread deciduous trees and a ground flora of grass, which get burnt by fire or the scorching sun during the long dry season. This affects the food security of many families. The district has 11 primary schools, 5 junior high schools (JHS) and one community senior high school (SHS) [23]. The predominant ethnic group is Nabra with few Talensi and Frafras. Christians and Muslims are the dominant religious groups in the district independent variables for this study were Water, Sanitation and Hygiene practices of mothers/caregiver’s Dependent variables for this study included: Stunting Stunted growth refers to low height-for-age, a child is considered to be stunted when he/she is short for his/her age but not necessarily thin. It is also known as chronic malnutrition; it is associated with long-term developmental risks. The study population comprised the Children under five years old residing at NABDAM district in the Upper East Region (UER) and Mothers/Caregivers of children under five residing at NABDAM district in the Upper East Region (UER). The sampling frame included all households with children below five years old in the study area. A multi-stage sampling technique was used to arrive at participants for the study. The NABDAM district has five sub-districts and the five sub-districts together have 85 communities. All sub-districts were included in the study. Simple random sampling was used to select two communities from each sub-district to be included in the study. In each community, Health Volunteers were first used to enumerate households that have children under five years of age. A list of households was then generated from the enumeration, and simple random sampling used to arrive at the desired number of households to meet the sample size. One child was selected from each household; so, for the study, one child represents one household. Data from the 2014 Ghana Demographic Health Surveillance shows that the prevalence of chronic malnutrition in the region is 14.4% [24]. Sample size formula as presented below, a sample size of 312 was realized;
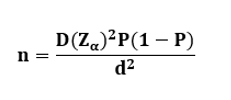
Where;
n= desired sample size
D= the design effect which is considered as 1.5
Zα= standard normal deviate set at 1.96 since a confidence level of 95% is considered
d= degree of accuracy set at 0.05
P= prevalence of chronic malnutrition which is 14.4% (0.144) (GDHS 2014).
Therefore
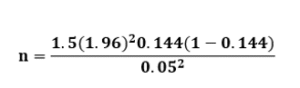
n= 284. Considering a non-response rate of 10% (28.4), the final sample size, n = 312.4 = 312. The sub-district populations differ from each other. As such a population proportionate approach was used to allocate the required sample size to each sub-district. A list of randomly generated households eligible for the study (as indicated in the sampling section) was given to data collectors to locate households and recruit them for the study. Community Health Volunteers (who reside in the study communities) were deployed to help data collectors locate the households. In each household, the data collectors approached the caregiver, obtain informed consent and recruited them into the study. Once informed consent was obtained, the data collectors then scheduled the caregivers for interviews and anthropometric measurements of index child at the caregiver’s convenience. If there are more than one eligible caregiver within one household, one caregiver will be selected randomly. However, if a caregiver has two or more children who are all qualified, the youngest child will be selected as the index child. Quantitative information was collected using a structured questionnaire in English employing both closed-ended and open-ended questions. The exact age of the child was recorded in months, based on information contained in child health records booklets, birth certificates and baptismal cards. Ages of children were determined using the date of birth (recorded from a verifiable document such as child health records booklet, birth certificate or baptismal card) and the date of measurement recorded in months. The weight of children was assessed using an electronic scale (SECA 890). All children in the selected households aged 6 to 59 months were weighed to the nearest 0.1 kg in minimum clothing. Height/Length measurements were taken following WHO standard procedures. An infant meter was used to measure the length of children less than two years of age (i.e. up to and including 23 months). The child was placed on its back (in a lying position) between the slanting sides, the head was placed so that it is against the top end, the knees were gently pushed down by a helper, the foot-piece was moved toward the child until it pressed softly against the soles of the child’s feet and the feet are at right angles to the legs. For children aged 24-59 months, their height was measured in a standing position. The child was made to stand without shoes on a level floor, the legs were placed against each other, as well as the heels, the buttocks, shoulder blades and head all made to rest against the measuring board, and the child was made to look straight ahead so that an imaginary plane that will connect the eyes and ears will be parallel to the floor and the arms hanged loosely by the sides. The length/height was measured to the nearest 0.1 cm. MUAC was measured in centimetres, to the nearest 0.1cm, using standard MUAC measuring tape. The data collectors were trained to locate the mid-point between the shoulder, and the tip of the elbow on the left arm with the arm bent at a right angle in order to locate the mid-point. The measurement was taken at this mid-point with the arm extended and relaxed. Bilateral Oedema was diagnosed by placing both thumbs on the upper side of the feet and applying pressure for about three seconds. Oedema was considered to be present if a skin depression remained after the pressure is released as weight, height and MUAC) were taken twice for each child and the average figure recorded as the final reading. Data analysis for the quantitative data was carried out statistically using basic techniques for descriptive and inferential statistics with the aid of computer software (SPSS) version 23 for windows.
- RESULTS & DISCUSSION
Tables 01 below details the socio-demographic characteristics of respondents including sex, level of education, ethnicity, marital status, occupation, pregnant/lactating, length of stay, number of children, age and religion. Most (90%) of all respondents were female with majority of them lactating and 5% pregnant as at the time of data collection. Among the respondents, only 2% representing 5 respondents represented parents within our target population. Over 70% of respondents had children between 1 through 3. But only 20% of respondents had over 3 children. Majority of respondents interviewed were adults between 15-49 years with majority of them married/living together. 81% of all respondents belong to the Nabra ethnic group, and 76% Christians. Of all the 314 respondents interviewed majority of them had no formal education and majority of them are farmers.
Table 01: Socio-Demographic Characteristics of Respondents
| N=291 Food item | Frequency N = 314 | Percentage (%) | Cumulative Percent |
| Community | |||
| Dagliga | 31 | 10 | 9.9 |
| Gane | 31 | 10 | 19.8 |
| Gunwagre | 36 | 12 | 31.3 |
| Karintabig | 29 | 9 | 40.3 |
| Kugre | 30 | 49.9 | |
| Noygbare | 35 | 11 | 61.1 |
| Pelungu | 32 | 10 | 71.3 |
| Saasua | 31 | 10 | 81.2 |
| Zambong | 34 | 11 | 92 |
| Zua | 25 | 8 | 100 |
| Sex | Frequency | Percentage (%) | Cumulative Percent |
| Male | 31 | 10 | 10 |
| Female | 278 | 90 | 100 |
| Pregnant/Lactating | Frequency | Percentage (%) | Cumulative Percent |
| Pregnant | 15 | 5 | 4.8 |
| Lactating | 177 | 57 | 61.7 |
| None | 119 | 38 | |
| Number of Children | Frequency | Percentage (%) | Cumulative Percent |
| Zero | 5 | 2 | 1.6 |
| One | 91 | 29 | 30.6 |
| Two | 88 | 28 | 58.6 |
| Three | 67 | 21 | 79.9 |
| More than three | 63 | 20 | 100 |
| Age | Frequency | Percentage (%) | Cumulative Percent |
| 15 years | 6 | 2 | 1.9 |
| 15-49 years | 292 | 93 | 94.9 |
| Above 49 years | 14 | 5 | 99.4 |
| Marital Status | Frequency | Percentage (%) | Cumulative Percent |
| Married or living together | 295 | 93 | 93.9 |
| Divorced/Separated | 6 | 2 | 95.9 |
| Widowed | 1 | 1 | 96.2 |
| Never married/lived together | 12 | 4 | 100 |
| Religion | Frequency | Percentage (%) | Cumulative Percent |
| Christianity | 239 | 76 | 76.1 |
| Islam | 10 | 3 | 79.3 |
| African Traditional Religion | 65 | 21 | 100 |
| Length of Stay | Frequency | Percentage (%) | Cumulative Percent |
| less than one year | 16 | 5 | 5.1 |
| 1-4 years | 38 | 12 | 17.3 |
| Five years or more | 259 | 83 | 100 |
| Ethnicity | Frequency | Percentage (%) | Cumulative Percent |
| Nabt | 261 | 81 | 83.1 |
| Taling | 21 | 7 | 89.8 |
| Frafra | 27 | 9 | 98.4 |
| Kusasi | 1 | 1 | 98.7 |
| Other | 4 | 2 | 100 |
| Occupation | Frequency | Percentage (%) | Cumulative Percent |
| Farmer | 193 | 62 | 61.5 |
| Teacher | 9 | 3 | 64.3 |
| Trader | 54 | 17 | 81.5 |
| Nurse | 8 | 3 | 84.1 |
| Other | 50 | 15 | 100 |
| Level of Education | Frequency | Percentage (%) | Cumulative Percent |
| No formal | 135 | 43 | 43.1 |
| Primary | 88 | 28 | 71.2 |
| Junior High School | 47 | 16 | 86.2 |
| Senior High School | 26 | 8 | 94.6 |
| Tertiary | 17 | 5 | 100 |
Using MUAC, table 02 illustrates the nutritional statuses of children under five within our target population. From the study, 94% of respondents were well nourished and only 6% were moderately malnourished.
Table 02: Nutritional Statuses of Children based on MUAC
| Nutritional Status | Frequency | Percent |
| Moderately malnourished | 19 | 6 |
| Well nourished | 272 | 94 |
| Total | 291 | 100 |
The chi-square test statistics in Table 03, shows no sign of association between, presence of bilateral pitting oedema and nutritional status (MUAC). Amongst the 291 relevant under five children studied, only 2 children were not checked for presence of bilateral pitting as indicated in the table above. Of all 289 children checked, there was no presence of bilateral pitting. Among them, 93% were well nourished and only 7% were moderately malnourished.
Table 03: Presence of Bilateral Pitting Oedema (+, ++ or +++)/MUAC
| MUAC | Total | ||||
| Moderately malnourished | Well nourished | ||||
| Presence of bilateral pitting oedema (+, ++ or +++) | No | 19 | 270 | 289 | |
| 6.6% | 93.4% | 100% | |||
| Not Checked | 0 | 2 | 2 | ||
| 0.0% | 100% | 100% | |||
| Total | 19 | 272 | 291 | ||
| 6.5% | 93.5% | 100% | |||
Table 04: Chi-Square Test of Relationship between Bilateral Pitting Oedema (+, ++ or +++)/MUAC
| Value | df | A symp. Sig. (2-sided) | Exact Sig. (2-sided) | Exact Sig. (1-sided) | |
| Pearson Chi-Square | .141a | 1 | .708 | ||
| Continuity Correction | .000 | 1 | 1.000 | ||
| Likelihood Ratio | .271 | 1 | .603 | ||
| Fisher’s Exact Test | 1.000 | .873 | |||
| Linear-by-Linear Association | .140 | 1 | .708 | ||
| N of Valid Cases | 291 |
Observing proportions of table 05 below indicates differences in proportions across columns which indicates some level of relationship between diarrhoea and MUAC. The chi-square statics in table 4.6 shows a chi square value of 4.266 indicating dependence between variables because the Chi-square statistic is significant at the .05 level as p-value is less than alpha value (.032<.05). This indicates that, the nutritional status of children under this study based on MUAC is dependent on diarrhoea.
| MUAC | Total | ||||
| Moderately malnourished | Well nourished | ||||
| Diarrhea | No | 18 | 193 | 211 | |
| 8.5% | 91.5% | 100% | |||
| Yes | 1 | 74 | 75 | ||
| 1.3% | 98.7% | 100% | |||
| Don’t Know | 0 | 5 | 5 | ||
| 0% | 100% | 100% | |||
| Total | 19 | 272 | 291 | ||
| 6.5% | 93.5% | 100% | |||
Table 06: Chi-Square Tests – Diarrhoea/MUAC
| MUAC | ||
| Diarrhoea | Chi-square | 4.622 |
| df | 1 | |
| Sig. | .032 | |
Table 07 illustrates the prevalence of underweight based on weight-for-age z-scores (WAZ) by sex. As seen on the table, 19% of participants fall under the underweight category. Within this category, 14.4% of them are moderately underweight and 4.6% are severely underweight. 25.7% of boys are underweight, 19.3% are moderately underweight whilst 6.4% are severely underweight. 15.2% of girls are underweight and among them, 11.7% are moderately underweight whilst 3.6% are severely underweight. Generally, moderately underweight participants are more in all gender categories as compared to severely underweight participants.
Table 07: Prevalence of underweight based on weight-for-age z-scores by sex
| All
n = 306 |
Boys
n = 109 |
Girls
n = 197 |
|
| Prevalence of underweight
(<-2 z-score) |
(58) 19.0 %
(15.0 – 23.7 95% C.I.) |
(28) 25.7 %
(18.4 – 34.6 95% C.I.) |
(30) 15.2 %
(10.9 – 20.9 95% C.I.) |
| Prevalence of moderate underweight
(<-2 z-score and >=-3 z-score) |
(44) 14.4 %
(10.9 – 18.8 95% C.I.) |
(21) 19.3 %
(13.0 – 27.7 95% C.I.) |
(23) 11.7 %
(7.9 – 16.9 95% C.I.) |
| Prevalence of severe underweight
(<-3 z-score) |
(14) 4.6 %
(2.7 – 7.5 95% C.I.) |
(7) 6.4 %
(3.1 – 12.7 95% C.I.) |
(7) 3.6 %
(1.7 – 7.2 95% C.I.) |
Table 08 below illustrates prevalence of underweight by age based on WAZ. Majority of participants fall between 6-17 age group. Within the 6-17 age group, 90.4% have normal weight but 8.7 are moderately underweight and only 0.9% are severely underweight. Second in the rank is the 18-29 age group. Within 18-29 age group, 76.3% have normal weight, 21.5% are moderately underweight and only 2.2% are severely underweight. Least in the rank is 54-59 age group. Within this group, 55.6% have normal weight, 22.2% are moderately underweight as severe underweight category. Generally, majority of respondents have normal weight in all age categories.
Table 08: Prevalence of underweight by age, based on weight-for-age z-scores
| Severe underweight
(<-3 z-score) |
Moderate underweight
(>= -3 and <-2 z-score) |
Normal
(> = -2 z score) |
Oedema | ||||||
| Age (mo.) | Total no. | No. | % | No. | % | No. | % | No. | % |
| 6-17 | 115 | 1 | 0.9 | 10 | 8.7 | 104 | 90.4 | 0 | 0.0 |
| 18-29 | 93 | 2 | 2.2 | 20 | 21.5 | 71 | 76.3 | 0 | 0.0 |
| 30-41 | 39 | 4 | 10.3 | 6 | 15.4 | 29 | 74.4 | 0 | 0.0 |
| 42-53 | 38 | 4 | 10.5 | 3 | 7.9 | 31 | 81.6 | 0 | 0.0 |
| 54-59 | 9 | 2 | 22.2 | 2 | 22.2 | 5 | 55.6 | 0 | 0.0 |
| Total | 294 | 13 | 4.4 | 41 | 13.9 | 240 | 81.6 | 0 | 0.0 |
Table 09 illustrates prevalence of stunting based on height-for-age z-scores (HAZ) by sex. In comparing girls to boys in absolute terms, more girls (90) are stunting than boys (61) but within each category, more boys (57.5%) are stunting as compared to girls (46.9%). To reduce skewness, comparing gender within categories is most preferred. Within the majority category (boys), 49.1% are severely stunting and only 8.5% are moderately stunting. Among girls, 37% are severely stunting and only 9.9% are moderately stunting. In all gender categories, participants who are severely stunting is high. Within the relevant population of all participants, 50.7% are stunting and out of this 41.3% are severely stunting.
Table 09: Prevalence of stunting based on height-for-age z-scores and by sex
| All
n = 298 |
Boys
n = 106 |
Girls
n = 192 |
|
| Prevalence of stunting
(<-2 z-score) |
(151) 50.7 %
(45.0 – 56.3 95% C.I.) |
(61) 57.5 %
(48.0 – 66.5 95% C.I.) |
(90) 46.9 %
(39.9 – 53.9 95% C.I.) |
| Prevalence of moderate stunting
(<-2 z-score and >=-3 z-score) |
(28) 9.4 %
(6.6 – 13.2 95% C.I.) |
(9) 8.5 %
(4.5 – 15.4 95% C.I.) |
(19) 9.9 %
(6.4 – 14.9 95% C.I.) |
| Prevalence of severe stunting
(<-3 z-score) |
(123) 41.3 %
(35.8 – 46.9 95% C.I.) |
(52) 49.1 %
(39.7 – 58.4 95% C.I.) |
(71) 37.0 %
(30.5 – 44.0 95% C.I.) |
Table 10 below illustrates the prevalence of stunting by age based on HAZ. Within the majority age category (6-17), normal stunting and severe stunting are each 47.3%, but moderate stunting is only 5.5%. With the second major age category (18-29), 50% are within normal range and 41.1% are severely stunting. Only 8.9% are moderately stunting. 54-59 being the least age category, 11.1% are moderately stunting whilst severe stunting and normal are each 44.4%. Generally, number of participants who are normal and those who are severely stunting is the same in all categories except for 18-29, 42-53 age categories.
Table 10: Prevalence of stunting by age based on height-for-age z-scores
| Severe stunting
(<-3 z-score) |
Moderate stunting
(>= -3 and <-2 z-score) |
Normal
(> = -2 z score) |
|||||
| Age (mo.) | Total no. | No. | % | No. | % | No. | % |
| 6-17 | 110 | 52 | 47.3 | 6 | 5.5 | 52 | 47.3 |
| 18-29 | 90 | 37 | 41.1 | 8 | 8.9 | 45 | 50.0 |
| 30-41 | 39 | 16 | 41.0 | 7 | 17.9 | 16 | 41.0 |
| 42-53 | 38 | 7 | 18.4 | 6 | 15.8 | 25 | 65.8 |
| 54-59 | 9 | 4 | 44.4 | 1 | 11.1 | 4 | 44.4 |
| Total | 286 | 116 | 40.6 | 28 | 9.8 | 142 | 49.7 |
Table 11, below illustrates the prevalence of overweight based on weight-for-height z-scores (WHZ) and by sex. 21.1% of the relevant population are overweight, among these overweight population, 13.3% are severely overweight. Of all 95 boys within the sample population, 21 of them are overweight representing 22.1% and only 15.8% out of this is severely overweight. 33, out of 161 girls representing 20.5% of the relevant population are overweight and only 11.8% are severely overweight. Generally, very few of them are severely overweight.
Table 11: Prevalence of overweight based on weight-for-height cut off’s and by sex (no oedema)
| All
n = 256 |
Boys
n = 95 |
Girls
n = 161 |
|
| Prevalence of overweight (WHZ > 2) | (54) 21.1 %
(16.5 – 26.5 95% C.I.) |
(21) 22.1 %
(14.9 – 31.4 95% C.I.) |
(33) 20.5 %
(15.0 – 27.4 95% C.I.) |
| Prevalence of severe overweight (WHZ > 3) | (34) 13.3 %
(9.7 – 18.0 95% C.I.) |
(15) 15.8 %
(9.8 – 24.4 95% C.I.) |
(19) 11.8 %
(7.7 – 17.7 95% C.I.) |
Table 12, illustrates the prevalence of overweight by age using WHZ. In the table below, no participant within age group 54-59 is overweight. Within 42-53 age group, only 2 participants are overweight representing 5.7% of the relevant population. Age group 30-41 also have only 12.9% being overweight and 9.7% of the relevant population being severely overweight. Within the majority age group (6-17), 34.3% are overweight and 23.2% being severely overweight. Generally, in all age categories, number of overweight participants are more as compared to number severe overweight participants.
Table 12: Prevalence of overweight by age, based on weight-for-height (no oedema)
| Overweight
(WHZ > 2) |
Severe Overweight (WHZ > 3) | ||||
| Age (mo.) | Total no. | No. | % | No. | % |
| 6-17 | 99 | 34 | 34.3 | 23 | 23.2 |
| 18-29 | 74 | 10 | 13.5 | 5 | 6.8 |
| 30-41 | 31 | 4 | 12.9 | 3 | 9.7 |
| 42-53 | 35 | 2 | 5.7 | 0 | 0.0 |
| 54-59 | 7 | 0 | 0.0 | 0 | 0.0 |
| Total | 246 | 50 | 20.3 | 31 | 12.6 |
Table 13 illustrates the relationship between WASH practices and the nutritional status of children under five. As seen chi square test indicated, source of water, water source location, water collection container, water storage methods, methods of cleaning container, location of toilet, children use of toilet, stool disposal, length of time to source water, storage materials covered, frequency of cleaning water containers, making water safer, share toilet and hand washing after defecation and hand washing methods are not related to nutritional status of children as p-values<alpha (.05). The only WASH practice strongly associated with nutritional status of children under 5 is Source of Drinking Water. The chi-square test value of 6.5 is significant at .023 as p-value<alpha (0.023<0.05). Child defecation in toilet is also associated with MUAC, however, it is fairly significant as chi-square test value is significant at 0.270 which is fairly <0.05 alpha level. Handwashing with water only and handwashing with water and ashes are also fairly related to MUAC, as their chi-square test values are significant at 0.061 and 0.173 which are fairly <0.05 alpha level.
| N= 291 | Moderately malnourished | Well nourished | |
| Source of drinking water | |||
| Borehole | 14 | 238 | |
| 73.7% | 87.5% | ||
| Protected well | 1 | 22 | |
| 5.3% | 8.1% | ||
| Unprotected well | 3 | 9 | |
| 15.8% | 3.3% | ||
| Hand dug well | 1 | 3 | |
| 5.3% | 1.1% | ||
| Total | 19 | 272 | |
| 100% | 100% | ||
| Location of Water source location | |||
| In own dwelling | 1 | 22 | |
| 5.3% | 8.1% | ||
| In the community | 18 | 246 | |
| 94.7% | 90.8% | ||
| Elsewhere | 0 | 3 | |
| 0.0% | 1.1% | ||
| Total | 19 | 271 | |
| 100% | 100% | ||
| Length of time to source | |||
| 0-30 minutes | 16 | 217 | |
| 84.2% | 79.8% | ||
| 30-1 Hours | 3 | 49 | |
| 15.8% | 18.0% | ||
| more than 1 hour | 0 | 6 | |
| 0.0% | 2.2% | ||
| Total | 19 | 272 | |
| 100% | 100% | ||
| Water collection containers | |||
| Covered containers | 1 | 28 | |
| 3.40% | 96.60% | ||
| Uncovered containers | 18 | 242 | |
| 6.90% | 93.10% | ||
| Don’t Know | 0 | 1 | |
| 0% | 100% | ||
| Total | 19 | 272 | |
| 6.50% | 93.50% | ||
| Water storage methods | |||
| Plastic containers/Bucket | 15 | 205 | |
| 78.9% | 75.4% | ||
| Clayed pot | 3 | 30 | |
| 15.8% | 11.0% | ||
| Metal container | 0 | 5 | |
| 0.0% | 1.8% | ||
| Jerri cans | 1 | 30 | |
| 5.3% | 11.0% | ||
| Total | 19 | 270 | |
| 6.50% | 93% | ||
| Storage materials covered | |||
| No | 2 | 15 | |
| 10.5% | 5.6% | ||
| Yes | 17 | 255 | |
| 89.5% | 94.4% | ||
| Total | 19 | 270 | |
| 100% | 100% | ||
| Frequency of cleaning water containers | |||
| When fetching water | 8 | 105 | |
| 42.1% | 38.6% | ||
| When it is dirty | 7 | 55 | |
| 36.8% | 20.2% | ||
| Every day | 3 | 61 | |
| 15.8% | 22.4% | ||
| Every week | 0 | 22 | |
| 0.0% | 8.1% | ||
| Every month | 0 | 1 | |
| 0.0% | 0.4% | ||
| Total | 1 | 28 | |
| 6.50% | 93.50% | ||
| Methods of cleaning containers | |||
| Water and soap | 15 | 223 | |
| 78.9% | 82.0% | ||
| Water and ash | 0 | 3 | |
| 0.0% | 1.1% | ||
| Water only | 4 | 44 | |
| 21.1% | 16.2% | ||
| Total | 19 | 270 | |
| 100% | 100% | ||
| Making water safer | |||
| No | 16 | 221 | |
| 84.2% | 81.3% | ||
| Yes | 3 | 51 | |
| 15.8% | 18.8% | ||
| Total | 19 | 272 | |
| 100% | 100% | ||
| Share toilet | |||
| No | 4 | 25 | |
| 66.7% | 43.1% | ||
| Yes | 2 | 29 | |
| 33.3% | 50.0% | ||
| Don’t Know | 0 | 4 | |
| 0.0% | 6.9% | ||
| Total | 6 | 58 | |
| 100% | 100% | ||
| Location of toilet | |||
| In dwelling | 0 | 6 | |
| 0.0% | 10.9% | ||
| In the yard/ in front of house/farm land | 6 | 47 | |
| 100.0% | 85.5% | ||
| Elsewhere | 0 | 2 | |
| 0.0% | 3.6% | ||
| Total | 6 | 55 | |
| 100% | 100% | ||
| Children use toilet | |||
| No | 4 | 44 | |
| 66.7% | 84.6% | ||
| Yes | 2 | 8 | |
| 33.3% | 15.4% | ||
| Total | 6 | 52 | |
| 9.80% | 100% | ||
| Stool disposal | |||
| Put/Rinsed into Toilet/larine | 1 | 23 | |
| 5.9% | 9.2% | ||
| Buried | 5 | 66 | |
| 29.4% | 26.4% | ||
| Throwing into drain/ditch/garbage/open | 11 | 161 | |
| 64.7% | 64.4% | ||
| Total | 17 | 250 | |
| 100% | 100% | ||
| Hand washing after defecation | |||
| No | 1 | 6 | |
| 5.3% | 2.2% | ||
| Yes | 18 | 265 | |
| 94.7% | 97.8% | ||
| Total | 19 | 271 | |
| 100% | 100% | ||
| Hand washing methods | |||
| Use of tippy tap | 1 | 12 | |
| 5.6% | 5.1% | ||
| Use of butta | 1 | 22 | |
| 5.6% | 9.4% | ||
| Bucket | 16 | 201 | |
| 88.9% | 85.5% | ||
| Total | 18 | 235 | |
| 100% | 100% | ||
Table 14 show the tabulation of age verse diarrhoea. In table 4.12, only one child within the less than six months (<6) suffered diarrhoea representing 1.3% of all 78 children in all age groups. Closer look at the table reveals that, diarrhoea significantly sets in from 6 months onwards except for age category 54-59. Among all age categories, diarrhoea is more common with 6-17 age category and 18-29 age category at 35.9% and 29%. This indicates that, diarrhoea actually sets in and records higher exactly on the 6th month when complementary feeding starts.
| Diarrhea | Total | |||
| Yes | No | |||
| Age(months) | <6 | 1 | 8 | 9 |
| 11.1% | 88.9% | 100.0% | ||
| 1.3% | 3.5% | 3.0% | ||
| 6-17 | 28 | 87 | 115 | |
| 24.3% | 75.7% | 100.0% | ||
| 35.9% | 38.5% | 37.8% | ||
| 18-29 | 23 | 70 | 93 | |
| 24.7% | 75.3% | 100.0% | ||
| 29.5% | 31.0% | 30.6% | ||
| 30-41 | 13 | 27 | 40 | |
| 32.5% | 67.5% | 100.0% | ||
| 16.7% | 11.9% | 13.2% | ||
| 42-53 | 12 | 26 | 38 | |
| 31.6% | 68.4% | 100.0% | ||
| 15.4% | 11.5% | 12.5% | ||
| 54-59 | 1 | 8 | 9 | |
| 11.1% | 88.9% | 100.0% | ||
| 1.3% | 3.5% | 3.0% | ||
| Total | 78 | 226 | 304 | |
| 25.7% | 74.3% | 100.0% | ||
| 100.0% | 100.0% | 100.0% | ||
Table 15 below is a cross tabulation of age and diarrhoea within layers of MUAC. As indicated below, 19 participants were moderately malnourishing and they are within the age ranges of 6-17 and 18-29. 15 participants out of the 19 are within 6-17 age range and out of the 15, 14 participants did not suffer diarrhoea. Generally, within the moderately malnourished layer, aside 1 child who suffered diarrhoea within the 6-17 age group, no other child in all age groups suffered diarrhoea. Under the well-nourished layer, majority of children in all the age groups have not experience diarrhoea 14 days to the day of interview.
Table 15: MUAC (Age/Diarrhoea)
| MUAC | Diarrhoea | Total | ||||
| Yes | No | |||||
| Moderately malnourished | Age | 6-17 | 1 | 14 | 15 | |
| 6.7% | 93.3% | 100% | ||||
| 100% | 77.8% | 78.9% | ||||
| 18-29 | 0 | 4 | 4 | |||
| 0.0% | 100% | 100% | ||||
| 0.0% | 22.2% | 21.1% | ||||
| Total | 1 | 18 | 19 | |||
| 5.3% | 94.7% | 100% | ||||
| 100% | 100% | 100% | ||||
| Well nourished | Age | 6-17 | 25 | 64 | 89 | |
| 28.1% | 71.9% | 100% | ||||
| 33.8% | 33.9% | 33.8% | ||||
| 18-29 | 23 | 65 | 88 | |||
| 26.1% | 73.9% | 100% | ||||
| 31.1% | 34.4% | 33.5% | ||||
| 30-41 | 13 | 27 | 40 | |||
| 32.5% | 67.5% | 100% | ||||
| 17.6% | 14.3% | 15.2% | ||||
| 42-53 | 12 | 26 | 38 | |||
| 31.6% | 68.4% | 100% | ||||
| 16.2% | 13.8% | 14.4% | ||||
| 54-59 | 1 | 7 | 8 | |||
| 12.5% | 87.5% | 100% | ||||
| 1.4% | 3.7% | 3.0% | ||||
| Total | 74 | 189 | 263 | |||
| 28.1% | 71.9% | 100.0% | ||||
| 100% | 100% | 100% | ||||
| Total | Age | 6-17 | 26 | 78 | 104 | |
| 25% | 75% | 100% | ||||
| 34.7% | 37.7% | 36.9% | ||||
| 18-29 | 23 | 69 | 92 | |||
| 25.0% | 75.0% | 100% | ||||
| 30.7% | 33.3% | 32.6% | ||||
| 30-41 | 13 | 27 | 40 | |||
| 32.5% | 67.5% | 100% | ||||
| 17.3% | 13% | 14.2% | ||||
| 42-53 | 12 | 26 | 38 | |||
| 31.6% | 68.4% | 100.0% | ||||
| 16.0% | 12.6% | 13.5% | ||||
| 54-59 | 1 | 7 | 8 | |||
| 12.5% | 87.5% | 100% | ||||
| 1.3% | 3.4% | 2.8% | ||||
| Total | 75 | 207 | 282 | |||
| 26.6% | 73.4% | 100% | ||||
| 100% | 100% | 100% | ||||
Relationship between Hand washing Methods (with soap, with ash, water only, no hand washing) and Diarrhoea. A chi square measure shows the level of dependence between hand washing methods and diarrhoea occurrence. The measure shows that, hand washing with soap and water only are significantly related to diarrhoea occurrence but hand washing with ash and no hand washing are not related to diarrhoea as measure of relationship using chi square indicated. The occurrence of diarrhoea is dependent on Hand washing with soap and hand washing with water only as the chi-square value of 14.5 and 13.1 are all significant at alpha value of 0.05 (p-value < 0.05). Further chi square measure shows the relationship between hand washing practices and diarrhoea occurrence. The measure indicates that, hand washing after defecation, after handshake and after work are not related to diarrhoea occurrence among under five. However, diarrhoea occurrence is dependent on handwashing before/after eating and after changing babies’ diapers. The chi-square test values are only significant for hand washing before/after eating and after changing babies at 0.05 (p-value<alpha). Relationship between Diarrhoea Occurrence and WASH Practices (sharing toilet, frequency of cleaning storage containers, water storage methods and length of time in sourcing water). Another chi square test shows the degree of independence between diarrhoea occurrence and particular WASH practices including, sharing toilet, frequency of cleaning storage containers, water storage methods and length of time in sourcing water. As indicated on the table below, Diarrhoea is fairly related to frequency of cleaning storage containers. However, diarrhoea occurrence is significantly related to sharing toilet and water storage methods as chi-square test values are significant 0.05 alpha (p-values<.05). Further measure of relationship indicates the degree of independence of diarrhoea on making water safe, storage materials covered, types of water collection containers, water sources, and water source location. Diarrhoea is independent of making water safe (safe water practices), storage water covered. Relationship between diarrhoea and the other WASH practices indicates that, diarrhoea is dependent on types of water collection containers¸ water sources and water sources location as chi-square test values are significant at 0.05 alpha level.
DISCUSSION
Major findings of this study are that, some WASH practices observed in this study such as length of time to source water, storage materials covered, frequency of cleaning water containers, making water safer, share toilet and hand washing after defecation are not significantly and directly related to nutritional status of children under five based on MUAC. The WASH practice significantly and directly associated with nutritional status of children under 5 is Source of Drinking Water. Other WASH practices are related to MUAC though the strength of relationship is low. WASH practices which are fairly related to MUAC includes child defecation in toilet, handwashing with water only and handwashing with water and ash. This is in conformity to some recent studies which suggests that, malnutrition is linked to poor WASH practices [25,26]. Malnutrition is linked to poor WASH practices as a result of diarrhoea, nematode infection. Diarrhea and intestinal worms cause nutrient losses by diverting the nutrients needed for growth to the immune system to fight the infection [27,28]. In this study, handwashing with water only and handwashing with water and ash are related to nutritional status of children. Other forms of handwashing including handwashing with soap was observed to be related to MUAC through diarrhoea. This might be due to the fact that; handwashing prevents or reduces the occurrence of diarrhoea among children under five. In the study, diarrhoea occurrence is dependent on the handwashing method used. As observed in this study, the occurrence of diarrhoea is dependent on handwashing with soap. From this study, handwashing with ash has no significant relationship with diarrhoea, however, handwashing with water only does. Hence, diarrhoea occurrence is not dependent on handwashing with ash. No handwashing is also not significantly related to diarrhoea occurrence among under five in this study. Diarrhoea occurrence based on handwashing also depends on the before or aftermath of specific activity. Further analysis of data in this study reveals that, diarrhoea is not dependent on handwashing after work, handshake or after defecation. Diarrhoea is strongly dependent on handwashing before/after eating and after changing baby’s diapers. A similar study in Indonesia reported no statistically significant association between hand washing with soap and incidence of diarrhoea, however, it was found out that, children who practice hand washing with water and soap had lower percentage of diarrhoea than those who did not [29]. The frequency of times water storage containers is washed is fairly significantly related to nutritional status of children under five. The study observes that of all the 291 relevant respondents, 113 representing 43% of them wash storage containers only when fetching water. Of all 43% of the respondents who clean water storage containers when fetching water, 93% of them are well nourished and only 7% are moderately malnourished. In testing for independence between diarrhoea and frequency of times water storage containers are washed, there is no statistically significant relationship between them. Water storage methods unlike other safe water practices, does not have any significant relationship with nutritional status of children based on MUAC. However, it has significant relationship with diarrhoea. Safe water practices including storage materials covered, frequency of times water storage containers is washed were significantly related to diarrhoea. This is consistent with a similar study in Bangladesh which sought to assess the effects of source- versus household contamination of tube well water on child diarrhoea. From the study, safe storage significantly improved drinking water quality at the point of use and reduced child diarrhoea significantly. The study further details that, safe water storage combined with chlorination will heavily reduce contamination of stored water. It however concludes that, safe water storage if done properly can singularly increase quality of stored water [30]. One major WASH practice which is not directly associated with nutritional status of under-five is Share toilet. However, observing the statics closely, among 58 relevant respondents, respondents who share and respondents who do not share toilet facilities with their neighbours are 31 and 29. Difference in cross values (29/25) of share toilet and nutritional status is not significant. However, a chi square statistic shows that, diarrhoea is dependent on sharing toilet facility. This is consistent with a study which sought to assess the association between the increasing prevalence of diarrhoea and shared sanitation in 51 countries, with majority of them being developing countries. Findings revealed that, in many countries, though sharing increased coverage, sharing a toilet facility was associated with an increased prevalence of diarrhoea among children < 5 years of age. This is because, transmission could be occurring because shared facilities, particularly those that are communally owned, may be more difficult to clean and maintain. Also, shared facilities of all types may be overused and increase the amount of epidemiologic contact between users. Other than cleanliness, persons may periodically choose to practice open defecation, or some other less hygienic means of excrement disposal, when shared facilities are deemed unsafe or inconvenient because of distance or long lines. Shared latrines may also fill up more rapidly and require more frequent emptying, which raises additional concerns about unsafe sludge management, creating another source of exposure. This study also observed that, it was not always the case where prevalence of diarrhoea increases as a result of sharing toilet facilities. The study observed that, in some few countries, households who shared toilet facilities were generally of a lower socioeconomic status than those that do not share and for that reason they are at increased risk of diarrhoea because of poverty in general, not necessarily because of sharing. Lower income households may not be able to afford proper hygienic practices [31].
- CONCLUSIONS
Malnutrition among children below the ages of five may be blamed for most childhood diseases and stunted growth. One of the major solutions to malnutrition is through effective and efficient childcare in households. The study assessed the water, sanitation and hygiene (WASH) practices among mothers/ caregivers in relation with the nutritional status of children under five years in the NABDAM district of the UER. From the study, 94% of respondents were well-nourished, and only 6% were moderately malnourished using MUAC. Stunting prevalence among children (<-2 z-scores) was (57.5%) and (46.9%) for boys and girls respectively. The prevalence of underweight was also 25.7% for boys and 15.2% for girls. The occurrence of diarrhoea is dependent on Handwashing with soap, and handwashing with water only as the chi-square value of 14.5 and 13.1 are all significant at alpha value of 0.05 (p-value < 0.05). The results also show that handwashing after defecation, after handshake and after work are not related to diarrhoea occurrence among under five. However, diarrhoea occurrence is dependent on handwashing before/after eating and after changing babies. In the study, diarrhoea occurrence significantly sets in 6-17 months. Diarrhoea occurrence is high within the lower age group and gradually reduces towards older age groups. However, nutritional status of children had remained significantly high in all age categories. While, severe stunting remained high in all age categories though severe underweight is low from the result of the study. In the study, diarrhoea occurrence significantly sets in 6-17 months. Diarrhoea occurrence is high within the lower age group and gradually reduces towards older age groups. However, nutritional status of children had remained significantly high in all age categories. While, severe stunting remained high in all age categories though severe underweight is low. The study also revealed that hand washing, shared toilet facilities and safe water storage are predictors of diarrhoea. Details of this relationship indicate that diarrhoea occurrence is dependent on handwashing after defecation, handwashing before eating or feeding child and handwashing with soap. With regards to safe water storage, storage methods are not significantly related to diarrhoea quantitatively. However, a qualitative analysis of relationship reveals that, of all 275 respondents who cover their water storage containers, 255 representing 94% of them are well-nourished
REFERENCES
- Abel, R., J. Rajaratnam, A. Kalaimani, and S. Kirubakaran. (2000). “Can Iron Status Be Improved in Each of the Three Trimesters? A Community-based study.” European Journal of Clinical Nutrition 54 (6) (June): 490.
- Nahal Mostak Khan, Soheb Ahmed Robin, Lutfullahil Khabir & Sohel Mahmud (2024). Role of Vitamin C in Development of Age Related Cataract. Dinkum Journal of Medical Innovations, 3(01):26-34.
- Amusu, A.M, Atulomah, N.O.S. Thomas M.A. Olanrewaju, M.F., and Degun A.M., (2011), Child care practices and nutritional status of infants of working mothers in day care centres in Oshun State, Nigeria. Journal of Biological Research, 2(5): 140-148
- Begin F, Frongillo EA Jr, Delisle H. (1999) Caregiver behaviours and resources influence child height-for-age in rural Chad. J Nutr; 129:680-6.
- Bradley, E. H., Curry, L. a., & Devers, K. J. (2007). Qualitative Data Analysis for HealthServices Research: Developing Taxonomy, Themes, and Theory. Health Services Research, 42(4), 1758–1772.
- Nistha Thapa, Puja Gartaula & Pushpa Chand Thakuri (2024). Knowledge of hygienic food-handling Practices among street Food vendors in Dhading Besi, District Dhading, Nepal. Dinkum Journal of Medical Innovations, 3(01):35-51.
- Christian, P., S. Khatry, K. West. (2004). “Antenatal anthelmintic treatment, birthweight, and infant survival in rural Nepal.” The Lancet 364: 981-83
- Clasen T.F., I.G. Roberts, T. Rabie, W.P. Schmidt, and S. Cairncross. (2006). “Interventions to improve water quality for preventing diarrhoea.” Cochrane Database of Systematic Reviews 2006, Issue 3. Art. No.: CD004794. DOI: 10.1002/14651858.CD004794.pub2.
- Development Initiatives, (2018). 2018 Global Nutrition Report: Shining a light to spur action on nutrition. Bristol, UK: Development Initiatives.
- Dewey, K.G., R.J. Cohen, K.H. Brown, and L.L. Rivera. (2001). “Effects of Exclusive Breastfeeding for Four Versus Six Months on
- Dewey, Kathryn G., and Seth Adu-Afarwuah. (2008). “Systematic Review of the Efficacy and Effectiveness of Complementary Feeding Interventions in Developing Countries.” Maternal & Child Nutrition 4 (s1) (April): 24–85. doi:10.1111/j.1740-8709.2007.00124.x.
- Manila Shrestha, Kalpana Sharma, Srijana Ghimire, Swarnima Maskey, Prakash Pariyar & Chandra Bahadur Sunar (2024). Missed Nursing Care at Tertiary Hospital, Bharatpur, Chitwan. Dinkum Journal of Medical Innovations, 3(10):716-732.
- Ejemot RI, Ehiri JE, Meremikwu MM, Critchley JA(2008): Hand washing for preventing diarrhoea. Cochrane Database Syst Rev. 1: CD004265
- Emergency Nutrition Network (ENN), 2018. Time to overcome the separation. Available at: ennonline.net/attachments/2870/WaSt-policy-brief-June-2018.pdf
- Gavino S. Nuñez Ii, Chelsea Angela R. Plasencia, Blessie B. Doble, Shiena Mitchelle L. Baldoza & Maricris B. Dionson (2024). Evaluation of Self-Care Practices of Pregnant Women in Barangay Apas, Cebu City, Philippines. Dinkum Journal of Medical Innovations, 3(08):581-596.
- Engle P. (1999) The role of caring practices and resources for care in child survival, growth, and developments: south and Southeast Asia. Asian Dev Rev 1999;17:132–67
- Ergin F, O. P., Atasoylu G, Beşer E. (2007). Nutritional status and risk factors of chronic malnutrition in children under five years of age in Aydin, a western city of Turkey. Turk J Pediatr 49(3): 283-9.
- Falade CO, Yusuf BO, Fadero FF, Mokuolu OA, Hamer DH, Salako LA. (2007). Intermittent preventive treatment with sulphadoxine-pyrimethamine is effective in preventing maternal and placental malaria in Ibadan, south-western Nigeria. Malar J; Jul 6;6:88.
- Fuller, J. A., Clasen, T., Heijnen, M., & Eisenberg, J. N. (2014). Shared sanitation and the prevalence of diarrhea in young children: evidence from 51 countries, 2001-2011. The American journal of tropical medicine and hygiene, 91(1), 173–180. doi:10.4269/ajtmh.13-0503
- Galler JR, Ramsey FC, Harrison RH, Brooks R, Weiskop, F. (1998) Bock S. Infant feeding practices in Barbados predict later growth. J Nutr ;128:1328-35.
- Greiner T. (1995), Sustained breastfeeding, complement-tation, and care. Food Nutr Bull ; 16:313-9.
- Ghana Statistical Service. (2013). 2010 Population & Housing Census. Ghana Statistical Service
- Gill, P., Stewart, K., Treasure, E., & Chadwick, B. (2008). Methods of data collection in qualitative research: interviews and focus groups. British Dental Journal, 204(6), 291–295.
- Hall, A. et al. A review and meta-analysis of the impact of intestinal works on child growth and nutrition. Maternal and Child Nutrition, 2008, 4:118-236 doi:10.1111/j.1740-8709.2007.00127.x
- Humphrey, Jean H. 2009. “Child Undernutrition, Tropical Enteropathy, Toilets, and Handwashing.” The Lancet 374 (9694) (September): 1032–1035. doi:10.1016/S0140-6736(09)60950-8.
- Ijarotimi O.S, Oyeneyin O.O (2005). Effect of economy restructuring on household food security and nutritional status of Nigeria children. J Food Agric Environ 2005;3 (3&4): 27-32.
- Imdad, A. and Z.A. Bhuta. 2012. “Routine iron/folate supplementation during pregnancy: effect on maternal anaemia and birth outcomes.” Paediatric and Perinatal Epidemiology. 26 Suppl 1:168-77. doi: 10.1111/j.1365-3016.2012.01312.x.
- International Food Policy Research Institute. (2014). Global Nutrition Report 2014: Actions and Accountability to Accelerate the World’s Progress on Nutrition. Washington, DC.
- National Development Planning Commission, NDPC. (2016), Social and Economic Impact of Child Undernutrition on Ghana’ s Long-Term Development.
- UNICEF, (2006): (United Nations Children’s Fund): The State of the world children.
- UNICEF, (2007): (United Nations Children’s Fund): Report of a Technical Consultation New York, USA September 25-26, on GOBI-FFF: growth monitoring, oral rehydration, breastfeeding, immunization, family planning, food supplementation and female literacy.
Publication History
Submitted: March 11, 2025
Accepted: March 28, 2025
Published: March 31, 2025
Identification
D-0415
DOI
https://doi.org/10.71017/djmi.4.3.d-0415
Citation
Edward Agongo (2025). Water, Sanitation and Hygiene Practices of Mothers/Caregivers in Relation to Nutritional Status of Children Under Five Years in the NABDAM District. Dinkum Journal of Medical Innovations, 4(03):104-123.
Copyright
© 2025 The Author(s).