Publication History
Submitted: October 31, 2024
Accepted: November 22, 2024
Published: March 31, 2025
Identification
D-0585
DOI
https://doi.org/10.71017/djnsi.4.4.d-0585
Citation
Suresh Raj Acharya , Kaushal Chandra GC , Sunil Rakhal & Binita Poudel (2025). Performance Assessment of Urban Water Supply Projects of Gandaki Province. Dinkum Journal of Natural & Scientific Innovations, 4(04):258-271.
Copyright
© 2025 The Author(s).
Vol. 4 No. 04 (2026) Original Article 
258-271
Performance Assessment of Urban Water Supply Projects of Gandaki ProvinceOriginal Article
Suresh Raj Acharya 1*, Kaushal Chandra GC 2, Sunil Rakhal 3 & Binita Poudel 4
- Pashchimanchal Campus (Western Region Campus), Gandaki Province, Nepal.
- Pashchimanchal Campus (Western Region Campus), Gandaki Province, Nepal.
- Pashchimanchal Campus (Western Region Campus), Gandaki Province, Nepal.
- Pashchimanchal Campus (Western Region Campus), Gandaki Province, Nepal.
* Correspondence: sureshacharya92@gmail.com
Abstract: The act of analyzing the efficacy and efficiency of a system, project, or organization is referred to as performance assessment. This evaluation is carried out by measuring certain key performance indicators (KPIs) that are related to many aspects of performance, including technical, financial, and institutional performance facets. The performance of urban water supply projects in Gandaki Province, Nepal, focusing on the First Small Town Water Supply and Sanitation Project (STWSSSP-I). Using key performance indicators (KPIs) set by the Ministry of Water Supply (MOWS) and aligned with ISSAU and SEIU standard. This study assessed technical, financial, and institutional performance across 11 KPIs, including water supply coverage, per capita consumption, continuity and reliability, metering ratio, non-revenue water, operating ratio, billing efficiency, collection efficiency, functionality index (questionnaire to user’s committee member), and redress ratio. It conducted random sampling to select four small town water supply projects in Gandaki Province: Lekh Nath, Khairenitar, Waling, and Kusma STWSSSP-I. While water supply coverage fell short of 100%, Lekh Nath met the SDG target, with all projects surpassing the national average. The study highlighted high institutional (87.96%), technical (77.64%), and financial (74.21%) performance, emphasizing the need to address water leakage, operational costs, and enhance institutional practices for improved urban water supply sustainability and efficiency. Several key actions are proposed, including increasing service provision to achieve 24/7 water supply, enhancing infrastructure to raise per capita water consumption to 100 lpcd, implementing a leakage management plan, maintaining water quality within NDWQS, strengthening institutional management, planning for rehabilitation due to aging infrastructure, preparing for future water scarcity, and ensuring timely budget allocation for project extensions.
Keywords: performance assessment, water supply, STWSSSP-I, Nepal
- INTRODUCTION
The act of analyzing the efficacy and efficiency of a system, project, or organization is referred to as performance assessment. This evaluation is carried out by measuring certain key performance indicators (KPIs) that are related to many aspects of performance, including technical, financial, and institutional performance facets [1]. In order to evaluate the quality of service, operational effectiveness, and overall performance of the entity that is being assessed, it is necessary to conduct an analysis of the data and information that is available [2]. In the end, performance evaluation contributes to the identification of areas of strength and weakness, as well as areas that require improvement, which eventually results in informed decision-making and strategic planning [3]. Nepal has made tremendous progress in increasing the provision of basic water services by employing a community management model to install and maintain water supply systems [4]. This has allowed Nepal to accomplish considerable gains in this area. At the moment, the majority of water supply systems across the nation are managed by water users and sanitation committees (WUSCs), which are made up of consumers [5]. With a few notable exceptions, such as KUKL, NWSC-managed systems, and certain board-operated systems, there are virtually no other systems [6]. In their capacity as utility operators or service providers, the WUSCs are accountable for the operations of water distribution, the collection of tariffs, and the upkeep of the systems [7]. On the other hand, the government continues to have ownership of the respective assets [8]. According to the Local Government Operation Act 2074, local authorities are responsible for carrying out service authority functions. These functions include the establishment and enforcement of by-laws, the planning and construction of new infrastructure or the rehabilitation of existing infrastructure, the provision of oversight and support to utility operators or service providers, and the conduct of regulation-based monitoring [9]. There is a critical need in Nepal to provide clean and reliable drinking water to the rapidly rising urban population, and the urban water supply projects play a crucial role in addressing this concern [10]. Providing access to water resources that are both safe and sufficient is becoming increasingly important for the purpose of promoting public health, improving the quality of life, and enabling sustainable urban growth as the pace of urbanization continues to increase [11]. These projects include a wide variety of strategic initiatives, such as the development of water treatment facilities, distribution networks that are efficient, and quality monitoring techniques that are stringent [12]. These projects aim to ease water scarcity and create knowledge about water conservation measures among members of the urban population [13]. They do this by combining the expansion of infrastructure with community participation. This thesis seeks to uncover the multidimensional impact of such initiatives, spanning environmental, social, and economic dimensions, and contribute to the larger discourse on effective urban resource management and equitable access to essential services [14]. As it delves into the complexities of urban water supply projects in Nepal, it seeks to uncover the impact of such initiatives. Nepal’s urban population has increased from 17% in 2011 to an estimated 40% presently, and it is anticipated to reach 50% by the year 2030 [14]. This rapid urbanization comes at a time when Nepal is experiencing rapid urbanization. This pattern has a substantial impact on the administration, programming, and management of WASH (Water, Sanitation, and Hygiene) services in metropolitan areas [16]. These small towns are characterized by populations ranging from 5,000 to 40,000 people and having year-round road access, grid power, and telecommunications [17]. The Government of Nepal has played a significant role in the delivery of water and sanitation services in these towns. These municipalities have a substantial capacity for expansion [18]. In accordance with the 15-Year Development Plan for Water Supply and Sanitation in Small Towns, which was initially drafted in 2009 and amended in 2015, the Asian Development Bank (ADB) has been a significant supporter of Nepal’s efforts from the year 2001 [19]. Participation from the Asian Development Bank has been essential to the enhancement of water and sanitation services. The initial Small Towns Water Supply and Sanitation Sector Project (STWSSSP) was carried out in a total of 29 municipalities and the project was completed in the year 2009. The second phase, which was completed in December 2017 and supported 21 municipalities, was followed by the third phase, which was finished in 2019 [20]. A significant number of water utilities have been inoperable as a result of a lack of exact arrangements from ownership and management, inadequate planning and maintenance, limited capacity, environmental issues, and a lack of sustainable funding [21]. The primary reasons for the non-functionality of water systems include the following: inadequate application of water safety standards; neglect; a lack of institutional, technical, and financial competence of the users’ committee to conduct significant repairs; and finance concerns [22]. As a result, these elements have an impact on the performance of the project in terms of its technical, financial, and institutional characteristics, as well as other relevant features including quantity, accessibility, reliability, quality, and ultimately sustainability [23]. Regarding the constructed water supply projects in Nepal, according to the Water Supply and Sanitation Status Report- B.S. 2079, 34.29 percent of the projects are fully functional, 18.43 percent of the projects require minor maintenance, and 6.71 percent of the projects require major maintenance in order to become fully operational [24]. Additionally, 24.15 percent of the total projects require rehabilitation, and 12.42 percent of the projects require reconstruction in order to reach the service level [25]. Taking into account these data, it is clear that ignoring and avoiding the requirements results in these projects being partially or completely non-functional [26]. It is therefore vital for the correct working and long-term viability of the projects to have a UC that is both powerful and capable, as well as to have its management in order [27]. In addition to this, the project must have proper design and construction, the establishment of an institutional Water Supply and Sanitation Users Committee (WSUC), the availability of technical human resources, the necessary tools and materials, and the necessary funds for operation and maintenance [28]. These are all essential components that must be present in order for the project to be functional and sustainable. In order to evaluate the performance of any project, it is possible to conduct an assessment of these components. In order to fill the gap this study assessed the overall performance of Urban Water Supply Projects of Gandaki Province WSP as well as assessed the financial performance of Urban Water Supply Projects of Gandaki Province.
- MATERIALS AND METHODS
Out of total 8 first small town water supply and sanitation sector projects in Gandaki Province, 4 first small town water supply and sanitation sector projects were selected through (simple random sampling) random computer numbers.
Table 01: Selection of projects by computer random number
| SN | First Small Town | ||
| Project | District | Random | |
| 6 | Walling STWSSSP | Syanja | 0.599 |
| 5 | Khairenitar STWSSSP | Tanhun | 0.948 |
| 4 | Lekhanath STWSSSP | Kaski | 0.914 |
| 1 | Kushma STWSSSP | Parbat | 0.909 |
| 8 | Beni STWSSSP | Myagdi | 0.548 |
| 2 | Prithivinarayan STWSSSP | Gorkha | 0.338 |
| 7 | Bandipur STWSSSP | Tanahun | 0.058 |
| 3 | Kawasoti STWSSSP | Nawalparasi | 0.853 |
During the process of data collection inform consent was taken from the concerned projects. Data entry, cleaning and analysis were done in Microsoft Excel. Data were collected during the period from 1st August to 28th December. The key performance indicators (KPIs) selected to evaluate performance was quantitative types. Quantitative KPIs or subsets measured objective things that can be expressed numerically, such as percentages or ratios. The research matrix presented in 7 reveals the linkage between the research objectives, data requirement and type of analysis.
Table 02: Linkage between the Research Matrices
| Objective | Variable | Analysis |
| To study the Technical Performance | Water Service Coverage | Quantitative |
| Per Capita Consumption | Quantitative | |
| Continuity and Reliability | Quantitative | |
| Metering Ratio | Quantitative | |
| Water Quality | Quantitative | |
| To analyze the Institutional Performance | Functionality Index | Quantitative |
| Complaints Management Redress Ratio | Quantitative | |
| To evaluate the Financial Performance | Non-Revenue Water (NRW) | Quantitative |
| Operating Ratio (OR) | Quantitative | |
| Billing Efficiency | Quantitative | |
| Collection Efficiency | Quantitative |
A study was conducted on four out of the eight Urban (Small-town-I) Water Supply and Sanitation Projects in Gandaki Province. Quantitative data are obtained to assess the system’s effectiveness. To determine the managerial aspects, revenue collection, technical matters, and operation and maintenance policies, WSUC members and staff were interviewed. Benchmarking data was gathered from data records spanning the last 1 to 2 years, derived from the fiscal year 2078-2079 audit report. A simple set of questions was prepared and asked of all WSUC members to find the Functionality Index. Secondary data were collected from published articles, journals, reports from the government organization like the Department of water supply and sewerage, conference papers, DPR, case studies, websites, reports, thesis, Annual audit reports of WSUCs, etc.
- RESULT & DISCUSSION
With the sole objective of assessing and comparing the project’s technical, institutional, and financial performance, the primary and secondary data sources are analyzed, and results are presented for the selected indicators. Moreover, field data has been collected for the fiscal year 078-079.
Table 03: Field Data (Institutional Performance)
| KPI No. | KPIs/ Subset | Question/ Statement | Unit | Data | |||
| Lekhnath | Khairenitar | Kusma | Waling | ||||
| 1 | Functionality Index | Total weightage from 10 sub-indicators (questionnaire) | no. | 100 | 100 | 100 | 100 |
| The weightage of received responses about inquiries posed to the consumer committee. | no. | 98.33 | 68.89 | 75.56 | 70.56 | ||
| 2 | Complaints management Redress ratio | Total number of complaints recorded in the complaints handling and redress logbook over a year | no. | 250 | 370 | 600 | 527 |
| Number of complaints resolved that year | no. | 250 | 345 | 590 | 520 | ||
The responses collected over a month were evaluated, and the values obtained as the Functional Index field data. Similarly, for the Complaints Management Redress Ratio, the data mentioned here has been taken from the consumer committee’s ‘Complaints Handling and Redress Logbook’ and the ‘Complaints Handling and Redress Policy and Procedures’ document.
Table 04: Field Data (Technical Performance)
| KPI No. | KPIs/ Subset | Question/ Statement | Unit | Data | |||
| Lekhnath | Khairenitar | Kusma | Waling | ||||
| 1 | Water Service Coverage | Total number of households in the service area | (HH) | 17,177 | 2955 | 3378 | 4212 |
| Total number of households served by the utility’s functional house or premises connections, community taps and public taps (Private+Public) | (HH) | 15,681 | 1810 | 2542+48 | 2852+5 | ||
| 2 | Per Capita Consumption | Total number of residential water users served by functioning connections | person | 116,399 | 17596 | 27344 | 32644 |
| The total daily volume of water billed to residential customers | m3 | 2,591,500 | 1120 | 659254 | 2129 | ||
| 3 | Continuity and Reliability | Average water supply hours per day | hrs/day
|
14 | 19 | 8 | 7 |
| 4 | Metering Ratio | Total connections provided in the distribution system | no. | 15,557 | 1810 | 2542 | 2852 |
| Number of connections with functional water meters | no. | 15,557 | 1810 | 2542 | 2852 | ||
| 5 | Water Quality | Total number of 100 mL samples from users’ taps tested for E. coli | no. | 200 | 12 | 15 | 48 |
| Total number of 100 mL samples tested for E. coli from users’ taps that met standards | no. | 200 | 12 | 15 | 48 | ||
Table 05: Field Data (Financial Performance)
| KPI No. | KPIs/ Subset | Question/ Statement | Unit | Data | |||
| Lekhnath | Khairenitar | Kusma | Waling | ||||
| 1 | NRW ratio | The total volume of water supplied into the distribution system over the performance evaluation year | m3 | 3,978,500 | 455338 | 935112 | 777085 |
| The total volume of water billed to the customers that year | m3 | 2,591,500 | 364750 | 659254 | 621668 | ||
| 2 | Operating Ratio (OR) | Total annual operating income from the sale of water and other water-related work | Rs. | 134,296,765 | 25636571 | 15109166 | 15155823 |
| Total annual operation and maintenance (O&M) costs | Rs. | 95,947,867 | 24154337 | 9352062 | 8457498 | ||
| 3 | Billing | Total number of known connections required to pay charges in the performance evaluation year | no. | 15,557 | 1810 | 2582 | 2857 |
| Number of connections billed that year | no. | 15,557 | 1800 | 2542 | 2852 | ||
| 4 | Collection | The total amount billed to the customers in the performance evaluation year | Rs. | 86,667,547 | 11336526 | 15109166 | 10107697 |
| Total cash collected from the total amount billed that year | Rs. | 82,374,040 | 11080526 | 12798608 | 10120306 | ||
Data showing 100% in the consumer committee’s records have been verified using two or more sources. These additional sources include the NWASH MIS developed by DWSSM, the official pages of the consumer committee on social media, and other published reports.
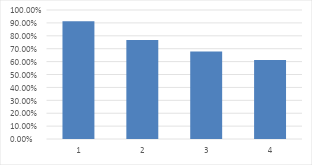
Figure 01: Water service coverage
The bar chart depicts the KPI (Key Performance Indicator) scores of four Water Supply Projects (WSPs) as percentages. Lekhnath WSP has the highest score at 91.29%, followed by Kusma Shivalaya WSP at 76.67%. Waling WSP and Khairenitar WSP have lower scores of 67.83% and 61.25%, respectively. The chart indicates a significant variation in performance levels among the four WSPs, with Lekhnath WSP notably outperforming the others.
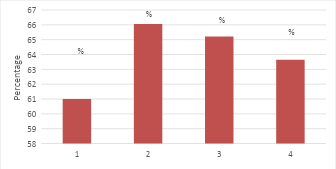
Figure 02: Per capita consumption
The bar chart illustrates the KPI (Key Performance Indicator) scores of four different Water Supply Projects (WSPs) in terms of percentage. Kusma Shivalaya WSP leads with the highest score at 66.05%, followed by Waling WSP at 65.22%. Khairenitar WSP and Lekhnath WSP have slightly lower scores of 63.65% and 61.00%, respectively. The scores are relatively close, indicating that all four WSPs have similar performance levels.
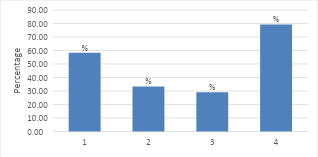
Figure 03: Continuity and Reliability
Continuity and Reliability across four water supply projects show varied service levels: Lekhnath: 58.33% (Avg: 14hrs/day), Kusma Shivalaya: 33.33% (Avg: 8hrs/day), Waling: 29.17% (Avg: 7hrs/day), Khairenitar: 79.17% (Avg: 19hrs/day). Improvements needed to reach the required 24hrs/day service level.
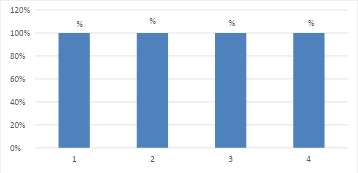 Figure 04: Metering Ratio
The bar chart shows that all four Water Supply Projects (WSPs) Lekhnath WSP, Kusma Shivalaya WSP, Waling WSP, and Khairenitar WSP achieved a KPI score of 100%. Each project is represented by a bar reaching the maximum value on the vertical axis, indicating perfect performance across all measured indicators. The consumer committees of all the mentioned projects observed that an additional user fee was imposed on consumers who couldn’t contribute their user fee during the construction phase or were unavailable. An additional user fee was also charged to consumers who had contributed their share after construction when new meter connections were made. Regular monitoring, organized information systems, and effective human resource management were noted. It was discovered that a fee had been levied on all households for tap/meter distribution in each committee. The connections are 100% metered, which indicates proper water accounting.
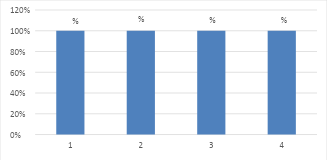 Figure 05: Water Quality
The bar chart presents the KPI scores for four Water Supply Projects (WSPs): Lekhnath, Kusma Shivalaya, Waling, and Khairenitar. Each project has achieved a KPI score of 100%, as indicated by the uniform height of the bars reaching the top of the chart. This suggests that all four WSPs have performed exceptionally well, meeting or surpassing their performance benchmarks without any discrepancies in their scores. E. coli contamination in drinking water strongly indicates sewage or animal waste contamination. Its detection in drinking water indicates the presence of fecal pathogens that can endanger the health of consumers. Although most E. coli strains cause only minor infections, their presence indicates the presence of other more pathogenic organisms that pose a risk to human health.
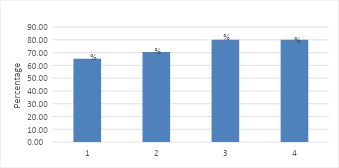
Figure 06: Non-Revenue water
In this study, NRW ratio was calculated as the difference between the water supplied and water sold (billed) i.e. volume of water ‘lost’ expressed as a percentage of net water supplied. The higher levels NRW are indication of poor system management, poor commercial practices, as well as indicator of inadequate pipeline maintenance, illegal connections; faulty water meter or miss reading may be also. Decreasing NRW ratio shows that WUSC Management team and Technical Staffs are aware about NRW and prime importance has been given in system management.
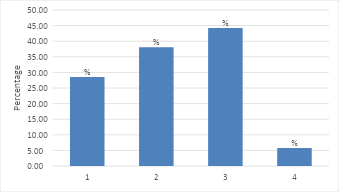 Figure 07: Operating Ratio
Operating Ratio (OR) values indicate the percentage of operation and maintenance costs covered by tariff revenues. Lower OR values signify better financial performance. Among the four water supply projects, the Waling project stands out for its superior financial performance, boasting the highest operating ratio of 44.2%. The operating performance across four water supply projects shows diversity: Lekhnath (28.56%), Kusma Shivalaya (38.10%), Waling (44.2%), and Khairenitar (5.78%). These figures suggest that incomes are efficiently covering operational expenses.
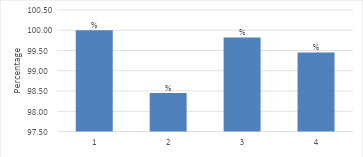 Figure 08: Billing Efficiency
The billing efficiency varies across the four water supply projects: Lekhnath (100%), Kusma Shivalaya (98.45%), Waling (99.82%), and Khairenitar (99.45%). This metric reflects operational and commercial efficiencies, influenced by factors like metering ratio, water tariff, timely billing practices, and billing accuracy. Near-perfect billing efficiency suggests high performance and effective coordination between consumers and consumer committees in the respective projects.
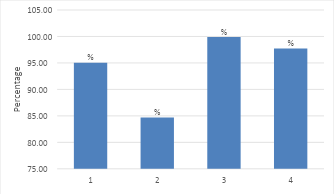
Figure 09: Collection Efficiency
KPI for collection efficiency vary across four water supply projects: Lekhnath (95.05%), Kusma Shivalaya (84.71%), Waling (99.88%), and Khairenitar (97.74%). There are no any accounts receivables indicating 100% efficiency in revenue collection within time.
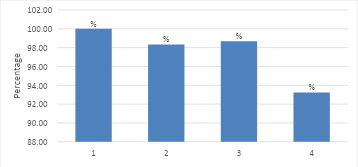
Figure 10: Complaints management Redress ratio
Collection efficiency vary across four water supply projects: Lekhnath (95.05%), Kusma Shivalaya (84.71%), Waling (99.88%), and Khairenitar (97.74%). The complaints of the customer are addressed within 24 hours and within 2-7 days depending upon the complexity of the problem.
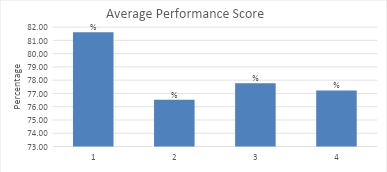
Figure 11: Average Performance Score (Gandaki Province)
The bar chart titled “Average Performance Score” presents the Key Performance Indicator (KPI) scores, expressed as percentages, for four Water Supply Projects (WSP) in Gandaki Province: Lekhnath WSP, Kusma Shivalaya WSP, Waling WSP, and Khairenitar WSP. Lekhnath WSP leads with the highest score of 81.61%, indicating superior performance in various operational aspects. Kusma Shivalaya WSP has the lowest score at 76.52%, suggesting areas for improvement compared to its counterparts. Waling WSP and Khairenitar WSP have similar performance scores of 77.76% and 77.22%, respectively, indicating moderate performance with potential for enhancement. Overall, the chart highlights the varying levels of efficiency and effectiveness among the water supply projects in the region. This study examined how using performance indicators in the Nepalese context by using 11 indicators developed by ISSAU and SEIU, forming four user’s committees as the primary basis, and conducting data analysis would facilitate a simple evaluation of STWSSSP I’s current status and conditions. The Lekhnath Water Supply project leads with 91.29% coverage, meeting the 2030 SDGs’ 90% objective. Project coverage ranges from 61.25% to 76.67% [29]. Coverage gaps remain. Despite exceeding the 15th Periodic Plan’s 40% coverage objective and the nationwide coverage of 25.69%, the Small Town First Project continues to expand coverage [30]. All of the listed projects have per capita consumption below urban area standards (100 lpcd), which indicates medium water service. The PCC also depends on consumer living standards, but water sales are far lower than production. SDG Goal 6 seeks universal access to safe drinking water [31]. However, ADB and JICA-mandated projects in Nepal have not yet achieved 24/7 quality water access. Improvements needed for 24/7 service. Water supply may not improve due to project lifespans, maintenance, and budget concerns despite fast population increase. Usage-based tap metering improves water efficiency, finds leaks, and charges high-end consumers fairly. Nepal uses flat-rate charging due to infrastructure issues with metering [32]. The NWASH MIS app, built by ISSAU for the Department of Water Supply and Sewerage Management, includes E. coli data for Lekhnath and Kusma Shivalaya Water Supply. E. coli in drinking water indicates faeces pollution and causes serious health hazards, according to the WHO [33]. Nepal’s National Drinking Water Quality Standards (NDWQS) include strict E. coli-free water limits to protect public health [34]. The Nepal Water Delivery Corporation (2019) claims that urban water delivery systems in Nepal struggle to maintain E. coli-free water, with an average compliance rate of 85%. However, all four Water Supply Projects (WSPs)—Lekhnath, Kusma Shivalaya, Waling, and Khairenitar achieve 100% KPI scores for E. coli testing, indicating that they have effective water treatment and monitoring systems. These WSPs are excellent water quality managers because their performance exceeds the national average and WHO requirements [35]. User committee members’ comments on the Functionality Index, which measures Water Supply Projects (WSPs) institutional performance, are intriguing [36]. Lekhnath WSP stands out with a 98.33% score, indicating strong institutional functionality. Kusma Shivalaya WSP scores 75.56%, whereas Waling and Khairenitar WSPs get 70.56%. This data shows that Kusma Shivalaya, Waling, and Khairenitar WSPs need improvement, whereas Lekhnath WSP outperforms global benchmarks [37]. The comparison shows the importance of institutional functionality in water service delivery and the potential benefits of adopting best practices from high-performing institutions to improve regional WSP performance.
- CONCLUSION
Various technical, institutional, and financial indicators were used to assess the performance of the Urban Water Supply Projects of Gandaki Province. Aligning with the theme of the study, these internationally accepted performance evaluation indicators are used for assessing the performance of the project, which has also been used for assessing the performance of different small and large-scale water service providers of Nepal and similar developing countries. Different literature related to the performance assessment of drinking water supply systems is reviewed to generate ideas and develop a methodology for assessing the performance of the water supply system in an easy and modern way. The study involved a descriptive research methodology to collect data from WUSC members and staff using questionnaires and personal interviews as the survey instrument. The study also collected and analyzed the past and present technical, institutional, and financial data relevant to the study. The analysis is done by direct field observation, interaction with the user’s committee, staff, consumers, and the records available, whereas secondary data are obtained from a literature review. In addition, vital conclusions derived from the study implications and recommendations regarding the performance of STWSSSP-I are included. While water supply coverage fell short of 100%, Lekh Nath met the SDG target, with all projects surpassing the national average. The study highlighted high institutional (87.96%), technical (77.64%), and financial (74.21%) performance, emphasizing the need to address water leakage, operational costs, and enhance institutional practices for improved urban water supply sustainability and efficiency. Several key actions are proposed, including increasing service provision to achieve 24/7 water supply, enhancing infrastructure to raise per capita water consumption to 100 lpcd, implementing a leakage management plan, maintaining water quality within NDWQS, strengthening institutional management, planning for rehabilitation due to aging infrastructure, preparing for future water scarcity, and ensuring timely budget allocation for project extensions.
- RECOMMENDATIONS
Based on the assessment of the technical, financial, and institutional performance of the First Small Town Water Supply and Sanitation Sector Project (STWSSSP-I) in Gandaki Province, the following major recommendations are suggested based on the findings and observations from the study area.
- Increase service provision in areas with low coverage to meet the 24/7 water supply goal.
- Enhance infrastructure to raise per capita water consumption to the urban standard of 100 liters per capita per day (lpcd).
- The study found that there is still a high rate of non-revenue water, so prepare the leakage management plan and search for advanced leakage detection technology.
- Sustain water quality (E. coli) within the National Drinking Water Quality Standards (NDWQS) for better serviceability.
- Strengthen Institutional Management: Maintain a high functionality index and ensure the prompt resolution of customer complaints.
- While observing the field and response from the users, employees, and management team members, the lifetime of water facilities is going to be met, so plan for rehabilitation and reconstruction works. And also ensuring timely budget allocation for project extensions.
- STWSSSP-I are the newly emerging towns with a high population growth rate. There will be a high scarcity of water in the future, and per capita consumption will increase with the increase in the standard of living. So, plan for additional per capita production of water.
REFERENCES
- Mishra, K., & Aithal, P. S. (2022). Performance Assessment of Irrigation: A Case from Nepal-Asia. International Journal of Management, Technology, and Social Sciences (IJMTS), 7(1), 444-464.
- Pandey, C. L. (2021). Managing urban water security: challenges and prospects in Nepal. Environment, Development and Sustainability, 23(1), 241-257.
- Gautam, G., & Dahal, K. R. (2020). Issues and problems of community water supply schemes with special reference to nepal. Journal of Civil, Construction and Environmental Engineering, 5(5), 114.
- GC, R. K., Ranganathan, S., Hammett, A. L., & Hall, R. P. (2021). What factors determine the technical performance of community-managed rural water systems in the middle hills of Nepal?. Journal of Water, Sanitation and Hygiene for Development, 11(2), 222-230.
- Otter, P., Sattler, W., Grischek, T., Jaskolski, M., Mey, E., Ulmer, N., … & Ndumwa, C. (2020). Economic evaluation of water supply systems operated with solar-driven electro-chlorination in rural regions in Nepal, Egypt and Tanzania. Water Research, 187, 116384.
- Gautam, G., Sharma, G., Magar, B. T., Shrestha, B., Cho, S., & Seo, C. (2021). Usage of IoT framework in water supply management for smart city in Nepal. Applied Sciences, 11(12), 5662.
- Gautam, G., Sharma, G., Magar, B. T., Shrestha, B., Cho, S., & Seo, C. (2021). Usage of IoT framework in water supply management for smart city in Nepal. Applied Sciences, 11(12), 5662.
- Maskey, G., Pandey, C., Bajracharya, R. M., & Moncada, S. (2021). Inequity in water distribution and quality: A study of mid‐hill town of Nepal. World Water Policy, 7(2), 233-252.
- Mishra, K., & Aithal, P. S. (2020). Financial Impact Assessment of Time Overrun: A Case of Second Small Towns Water Supply and Sanitation Sector Project, Nepal. International Journal of Applied Engineering and Management Letters (IJAEML), 4(2), 159-173.
- Shrestha, A., Kazama, S., & Takizawa, S. (2021). Influence of service levels and COVID-19 on water supply inequalities of community-managed service providers in Nepal. Water, 13(10), 1349.
- Shrestha, S., Aihara, Y., Bhattarai, A. P., Bista, N., Kondo, N., Futaba, K., … & Shindo, J. (2020). Urban household water resilience and source selection in Nepal pre-and post-disaster. Journal of Water, Sanitation and Hygiene for Development, 10(3), 435-446.
- Radzi, A. R., Farouk, A. M., Romali, N. S., Farouk, M., Elgamal, M., & Rahman, R. A. (2024). Assessing environmental management plan implementation in water supply construction projects: Key Performance Indicators. Sustainability, 16(2), 600.
- Nijhawan, A., Howard, G., Poudel, M., Pregnolato, M., Eunice Lo, Y. T., Ghimire, A., … & Mulugeta, Y. (2022). Assessing the climate resilience of community-managed water supplies in Ethiopia and Nepal. Water, 14(8), 1293.
- Nijhawan, A., Howard, G., Poudel, M., Pregnolato, M., Eunice Lo, Y. T., Ghimire, A., … & Mulugeta, Y. (2022). Assessing the climate resilience of community-managed water supplies in Ethiopia and Nepal. Water, 14(8), 1293.
- Ghimire, S., Pokhrel, N., Pant, S., Gyawali, T., Koirala, A., Mainali, B., … & Paudel, S. R. (2022). Assessment of technologies for water quality control of the Bagmati River in Kathmandu valley, Nepal. Groundwater for Sustainable Development, 18, 100770.
- Komatsu, S., Yamamoto, Y., Ito, Y., Kaneko, S., & Dhital, R. P. (2020). Water for life: ceaseless routine efforts for collecting drinking water in remote mountainous villages of Nepal. Environment, Development and Sustainability, 22, 7909-7925.
- Dev Joshi, G., Mishra, K., & Ghimire, E. J. G. (2020). Performance Assessment of Water Supply Scheme; A Case of Mangadh Water Supply Scheme, Nepal. TEST Engineering & Management, 83.
- Saraswat, C., Mishra, B. K., & Kumar, P. (2017). Integrated urban water management scenario modeling for sustainable water governance in Kathmandu Valley, Nepal. Sustainability Science, 12, 1037-1053.
- Jha, P. K., & Shrestha, K. K. (2013). Climate change and urban water supply: adaptive capacity local government in Kathmandu City, Nepal. Journal of Forest and Livelihood, 11(1), 62-81.
- Mishra, A. K., & Karna, A. K. (2019). Assessment of management transfer process of water supply systems in Sunsari District of Nepal. International Journal of Research Granthaalayah, 7(1), 1-24.
- Timilsena, N. (2020). Users’ Satisfaction with Domestic Water Supply in Nepal–A Study in Lekhnath Small Town Water Supply and Sanitation Project. Technical Journal, 2(1), 135-148.
- Mishra, K., & Aithal, P. S. (2022). Performance Assessment of Irrigation: A Case from Nepal-Asia. International Journal of Management, Technology, and Social Sciences (IJMTS), 7(1), 444-464.
- Pandey, C. L. (2021). Managing urban water security: challenges and prospects in Nepal. Environment, Development and Sustainability, 23(1), 241-257.
- Pandey, C. L., Maskey, G., Devkota, K., & Ojha, H. (2019). Investigating the institutional landscape for urban water security in Nepal. Sustainability: The Journal of Record, 12(3), 173-181.
- Ogata, R., Oniki, S., & Karki, K. B. (2024). Sustainable management of small-town water supply in Nepal: improvement through the multi-stage training mechanism. Journal of Water, Sanitation and Hygiene for Development, washdev2024034.
- Bhandari, B. S., Grant, M., & Pokharel, D. (2005). Sustainable community water: managing supply systems in the mid-hills of Nepal. Water policy, 7(2), 201-214.
- Mishra, K., & Shrestha, C. K. P. (2022). Status Assessment of Life Cycle Costing in Baitadi Town Water Supply and Sanitation Project, Nepal. SSRN.
- White, P., Badu, I. R., & Shrestha, P. (2015). Achieving sustainable water supply through better institutions, design innovations and water safety plans–an experience from Nepal. Journal of Water, Sanitation and Hygiene for Development, 5(4), 625-631.
- Gautam, G., & Dahal, K. R. (2020). Issues and problems of community water supply schemes with special reference to nepal. Journal of Civil, Construction and Environmental Engineering, 5(5), 114.
- Koirala, M. P. (2018). Urban Infrastructure Projects and Challenges, Risk Identifying for Emerging New Cities of Nepal. International Journal of Research—Granthaalayah, 6, 97-108.
- Bharti, N., Khandekar, N., Sengupta, P., Bhadwal, S., & Kochhar, I. (2020). Dynamics of urban water supply management of two Himalayan towns in India. Water Policy, 22(S1), 65-89.
- Domènech, L., March, H., & Saurí, D. (2013). Contesting large-scale water supply projects at both ends of the pipe in Kathmandu and Melamchi Valleys, Nepal. Geoforum, 47, 22-31.
- Raut, K. (2015). Sustainability of community water supply system managed by water user committee: a case study of rural water supply system in Nepal (Master’s thesis, Norwegian University of Life Sciences, Ås).
- Bhandari, B., & Grant, M. (2007). User satisfaction and sustainability of drinking water schemes in rural communities of Nepal. Sustainability: Science, Practice and Policy, 3(1), 12-20.
- Bright-Davies, L., Lüthi, C., & Jachnow, A. (2015). DEWATS for urban Nepal: a comparative assessment for community wastewater management. Waterlines, 119-138.
- Liu, E., & Binu, D. (2018, October). Study of the Project Financing Model in the Development of Water Supply Project in Nepal—Melamchi Water Supply Project Kathmandu Valley Water Supply and Sanitation Subproject (Subproject-2). In 3rd International Symposium on Asian B&R Conference on International Business Cooperation (ISBCD 2018) (pp. 483-490). Atlantis Press.
- Thapa, B. R., Ishidaira, H., Pandey, V. P., & Shakya, N. M. (2016). Impact assessment of Gorkha earthquake 2015 on portable water supply in Kathmandu Valley: preliminary analysis.
Publication History
Submitted: October 31, 2024
Accepted: November 22, 2024
Published: March 31, 2025
Identification
D-0585
DOI
https://doi.org/10.71017/djnsi.4.4.d-0585
Citation
Suresh Raj Acharya , Kaushal Chandra GC , Sunil Rakhal & Binita Poudel (2025). Performance Assessment of Urban Water Supply Projects of Gandaki Province. Dinkum Journal of Natural & Scientific Innovations, 4(04):258-271.
Copyright
© 2025 The Author(s).