

Publication History
Submitted: October 31, 2024
Accepted: November 22, 2024
Published: March 31, 2025
Identification
D-0598
DOI
https://doi.org/10.71017/djnsi.4.5.d-0598
Citation
Henry Spio Abakah (2025). Integration of Sentinel SAR and Optical Data for Cocoa Mapping in Ghana: Bekwai District as Case Study. Dinkum Journal of Natural & Scientific Innovations, 4(05):313-326.
Copyright
© 2025 The Author(s).
Vol. 4 No. 05 (2025) Original Article 
313-326
Integration of Sentinel SAR and Optical Data for Cocoa Mapping in Ghana: Bekwai District as Case StudyReview Article
Henry Spio Abakah 1*
- Kwame Nkrumah University of Science and Technology, Kumasi, Ghana.
* Correspondence: hsabakah@gmail.com
Abstract: Cocoa production in Ghana is crucial to both the economy and the global cocoa market due to the high quality of Ghanaian cocoa. The production rate is influenced by several factors, including climate change, soil conditions, and other environmental variables. Geographical Information Systems (GIS) and Remote Sensing (RS) have become essential tools in mapping cocoa-growing regions and analyzing these contributing factors to enhance cocoa production. This study leverages Earth Observation (EO) technologies to classify cocoa cultivation areas by integrating Sentinel Optical and Synthetic Aperture Radar (SAR) data in Google Earth Engine (GEE). The study focused on the Bekwai District in the Ashanti Region of Ghana, where Sentinel-2 (optical) and Sentinel-1 (SAR) data were utilized. A total of 1,000 training samples were collected via Google Earth Pro and categorized into five classes: Cocoa Areas, Vegetation/Forest, Water Bodies, Settlements, and Bare Land. A Machine Learning (ML) classification algorithm was applied to generate a Land Use Land Cover (LULC) map. Results indicated that the integration of Sentinel Optical and SAR data achieved the highest classification accuracy, with an accuracy rate of 85.14% and a Kappa coefficient of 0.87. This outperformed the use of Sentinel Optical data alone, which had an accuracy of 81.07% and a Kappa coefficient of 0.82. The lowest performance was recorded using Sentinel SAR data alone, with an accuracy of 78.12% and a Kappa coefficient of 0.80. The LULC map developed from this integration offers valuable insights for decision-making in the district and other organizations. The study revealed that approximately 70% of the district’s land area is dedicated to cocoa cultivation, which is vital for identifying productive regions and areas impacted by Cocoa Swollen Shoot Virus Disease (CSSVD), a major factor in reduced cocoa yields.
Keywords: integration, sentinel, SAR, optical data, cocoa mapping, Ghana, Bekwai district, case study
- INTRODUCTION
Cocoa (Theobroma cacao) is the most tropical tree species indigenous to the Americas, particularly the Amazon and Orinoco River basins. The global importance of cocoa is underscored by its role in the economies of many developing countries and its contribution to global commodity trade. There are many species available but the primary species of cocoa are criollo, Forastero, and Trinitario. Among these, Forastero is the most widely cultivated due to its robustness and higher yield compared to the other varieties [1,2]. This variety’s resilience makes it a staple crop for smallholder farmers, particularly in developing countries where over 30 million smallholders depend on cocoa production for their livelihoods [3]. As global demand for cocoa continues to rise, production is expected to increase to meet this demand [4], West Africa is the leading region in cocoa production, contributing approximately 41% of the global market share. In the 2015-2016 period alone, the region produced and exported approximately 1,650 million tons of cocoa beans, with between 800,000 and 1.3 million agricultural households engaged in cocoa production [5]. Major cocoa-growing regions include countries in tropical America such as Belize, Mexico, Ecuador, Peru, Costa Rica, and Brazil [6]; Southern Asia countries like Indonesia; and West African countries such as Côte d’Ivoire, Ghana, Nigeria, and Cameroon [7]. Ghana, the second-largest producer of cocoa globally, significantly depends on the commodity for foreign exchange earnings [8]. However, cocoa production in Ghana has been declining due to various challenges, including the aging of cocoa trees and disease outbreaks, particularly the Cocoa Swollen Shoot Viral Disease (CSSVD). This disease can drastically reduce yields by up to 70% and result in the death of cocoa trees within two to three years [9,10]. To combat these challenges, farmers are often advised to renovate or rehabilitate their cocoa farms [11]. However, these measures alone may not be sufficient to address the underlying issues affecting cocoa production. To enhance cocoa production and management practices, it is essential to understand land use patterns and the geographical arrangement of cocoa farms. Land activity and Vegetation Cover classification techniques offer a powerful tool for accurately mapping cocoa-growing areas and monitoring changes over time. These techniques are invaluable for decision-making, particularly in identifying suitable areas for cocoa cultivation and assessing the impact of environmental factors on cocoa production [12]. According to [13], successful decision-making in the production of cocoa requires a clear comprehension of the cocoa output distribution pattern and geography of cocoa-growing and harvesting areas. Remote Sensing (RS) and Spatial Information Systems hold a central role in this process, enabling researchers to analyze land utilization patterns and monitor evolutions over time [14]. The use of satellite imagery, which is readily available and capable of covering large areas, is particularly effective in this regard [15]. Earth Observation Satellites (EOS) have become indispensable tools for monitoring human activities and environmental changes worldwide. Each year, numerous EOS are deployed to monitor various activities, including agriculture, health, education, and urban planning [16]. These satellites generate vast amounts of Remote Sensing (RS) data daily, covering a wide range of electromagnetic bands from both active and passive sensors [17]. The data collected from EOS can be used to create detailed maps of land cover and assess the environmental consequences of human behavior [18]. High-resolution satellite imagery can provide valuable insights into land use patterns when processed using advanced techniques such as photogrammetric modeling and ground control points (GCP) [19]. However, traditional optical sensors can be obstructed by cloud cover and dense vegetation, that can impede visibility of the Earth’s surface. To address these limitations, Synthetic Aperture Radar (SAR) is often used. SAR has several advantages, making it a valuable tool in remote sensing. Unlike optical sensors, SAR can penetrate cloud cover and dense vegetation, allowing for continuous data collection regardless of weather conditions or time of day [20]. This is particularly important in tropical regions where frequent cloud cover can obscure optical images. SAR also provides high-resolution imagery, which is crucial for detailed mapping and analysis of land use patterns. Moreover, the active nature of SAR allows it to detect surface roughness and structure, which can be advantageous in various agricultural and environmental applications. However, SAR also has its drawbacks. One significant limitation is the complexity of SAR data processing. The data requires specific expertise and procedures for interpretation, making it less accessible to non-experts [21]. Additionally, SAR data can be affected by noise, which may reduce the accuracy of the results. Temporal constraints, such as the limited availability of SAR data over certain periods, can also pose challenges [22]. Furthermore, the polarization of SAR signals can lead to difficulties in distinguishing between different land cover types, particularly in urban or heterogeneous environments [23]. Finally, the high cost of SAR data acquisition and processing can be prohibitive for large-scale projects. Optical sensors are widely used in remote sensing due to their ability to capture high-resolution imagery across a broad spectrum of wavelengths. A contributor to the advantages of optical data is its capability to offer comprehensive and precise visual representation, making it easier to interpret and analyze [14]. Optical sensors can capture various spectral bands, allowing for detailed classification of different land cover types, which is essential for LULC analysis. Additionally, optical data is generally more accessible and cost-effective compared to SAR, making it a preferred choice for many Remote Sensing applications. The fusion of optical data with other data sources, such as SAR, can further enhance classification accuracy and provide a more comprehensive view of the study area. However, optical data has its limitations. The most significant disadvantage is its susceptibility to atmospheric conditions, particularly cloud cover, which can obscure the sensor’s view and result in incomplete or inaccurate data [11]. This is especially problematic in tropical regions, where cloud cover is persistent. Additionally, optical sensors are limited to daytime data collection, as they rely on sunlight for illumination. This restricts the temporal availability of optical data and can hinder continuous monitoring efforts. The presence of dense vegetation can also interfere with optical sensors, complicating the process of producing maps which are accurate maps for land cover in forested areas [13]. Finally, cloud masking in optical data processing can create gaps in the imagery, leading to potential classification errors [9]. Given the advantages and disadvantages of both SAR and optical data, integrating these two data sources offers a promising approach to improving the accuracy of LULC classification. Techniques such as stacking, co-registration, and data fusion have been employed to merge the advantages of data types [16]. The integration of SAR’s all-weather capabilities with the detailed spectral information provided by optical sensors can overcome the limitations of each data type, resulting in more accurate and reliable classification results. For instance, in urban environments, the combination of optical and radar data helps to capture a wider range of spectral signatures, improving the classification of diverse land cover types [12]. In tropical regions, where heavy cloud cover often obstructs optical imagery, radar data provides a viable alternative, ensuring continuous data availability throughout the year [6]. By leveraging the complementary strengths of optical and radar data, researchers can achieve higher classification accuracy and better monitor land use changes over time. Accurate LULC imagery is crucial for decision-making in cocoa production, as it provides valuable insights into land use patterns and the spatial distribution of cocoa farms. By integrating Sentinel imagery, either through single-sensor data or a combination of multiple sensors, this study created an accurate LULC map of the Bekwai District in Ghana. This map enabled better monitoring and management of cocoa-growing areas, ultimately supporting efforts to enhance cocoa yields in the region. The successful application of LULC classification techniques, backed by sophisticated technologies, will contribute to addressing the challenges facing cocoa production in Ghana. By leveraging the power of Earth Observation Satellites and integrating optical and radar data, researchers can improve the accuracy of their analyses and support informed decision-making for sustainable cocoa production.
- MATERIALS AND METHODS
Bekwai District is a municipality in the Ashanti Region of Ghana. Bekwai in Ghana is the seventy-ninth (79) district with the largest number of people settled there with a settlement population of 5,267 people. It was created as an assembly in Amansie East District. The district falls within latitudes 6° 19′ 27″N (6.324171N) to 6° 32′ 54″N (6.548335N) and longitudes 1° 47′ 11.274″W (1.786465W) to 1° 25′ 22″W (1.422644W). The district was split into two, the western part was decreed to create Amansie Central District, and the Eastern part was split to create Bosome Freho District. The land size of the municipal is about a total of 1,937 km2 which is less than 2.2% percent of the total land area of Ashanti region. The remaining part was elevated to municipal district assembly status and remained as such till it was named Bekwai Municipal Assembly. The district is located in the southern part of the Ashanti Region with the district capital town being Bekwai. The district shares boundaries with districts with Bosomtwe District to the North, Adasi North District to the southern part, Bosome-Freho District to the East, and Amansie Central and Amansie West to the west. It is 30.8 kilometers from the Ashanti Regional Capital which is Kumasi which is about 50 minutes’ drive when using the lake Bosomtwe road. The nature of the vegetation within the district lies within the moist – semi-deciduous forest zone. Soil in these forest zones are often fertile, supporting lush vegetation growth. There is as a part of the district which is a reserved forest with varieties of tree crops such as cocoa trees, Odum, Wawa, and other crops. It has a green zone which initially consists of the primary forest. Due to deforestation that primary forest has been reduced to the secondary forest. The vegetation zone in the district supports agriculture making it the dominant occupational activity in the district. Most of the people living in the district and its neighboring districts are engaged in all types of agriculture practices such as farming which involves planting food and cash crops [24]. The climate condition in Bekwai is such that the rainy season is oppressive and generally cloudy, the dry season is muggy and partly cloudy, and the weather is hot. The temperature normally ranges from 20.56 degrees Celsius to 35 degrees Celsius, with temperatures rarely falling below 17.78 degrees Celsius or rising over 38.33 degrees Celsius. The best time of year to visit Bekwai is late November to late January and also have a good moment to engage yourself in all activities available in the district [25]. The hot season lasts over months, from January to March, with an average daily high temperature exceeding 93°F. The hottest month in Bekwai is February, with an average high of 95°F and a low of 73°F. The chilly season lasts 3.9 months, from June 9 to October 5, with an average daily high temperature below 86°F. The coldest month in Bekwai is August, with an average low of 21.67°C to 28.89°C. The presence of numerous water bodies within Bekwai Municipal District plays a crucial role in the region’s ecology, agriculture, and daily life of the residents. These water bodies provide essential resources for irrigation, domestic use, and biodiversity conservation. Economically, these water bodies are indispensable for agriculture, which is the dominant occupational activity in the district. In the Bekwai Municipal in 2008, new districts were established, resulting in the separation of the Bosome-Freho constituency from the district with its capital located in Asiwa. Additionally, the Constituency was upgraded to a Municipal status and renamed the Bekwai Municipal Assembly, with its capital situated in Bekwai [26]. The population of the Municipality is 137,967 with males and females representing 48.3% and 51.7% respectively [27]. The economically active members within the community are populated to be 15 years and older which covers about 70% of the total population. Out of the economically active population, 95.6% are employed. Among the sexes, 71% of the males are economically active with 96% of them being employed. For the females, 69.1% are economically active out of which 95.3% are employed. The proportion of males (60.2%) who are in full-time education is higher than the females 39.2%). On the other hand, females who reported that they were not economically active because they engaged in domestic duties are more (28.3%) than their male (14.4%) counterparts. 80% of persons 11 years and older in the Municipality are literate in one language or the other (Ghana Statistical Service, 2021). Among the sexes, a higher proportion (87.6%) of the male population is literate compared to the female (73.6%). The study adopted GIS techniques and RS techniques to map cocoa farms in the Bekwai District in the Ashanti Region. Table 01 below gives a detail of the data and resources that were used needed to complete this research work. Details of the Sentinel SAR data were captured in Table 3.2. The specific Coordinate Reference System (CRS) and datum of the coordinated defining the coordinate system used for the dataset were World Geodetic System (WGS) 1984, Universal Transverse Mercator (UTM) Zone 30. The unit of measurement for the dataset for the Google Engine Codes was degree (0) while distances were also measured in kilometers. The projection method deployed for the research was the Transverse Mercator Projection. The accuracy of the coordinate system was looked at including the potential errors, root mean square (rms), and uncertainty associated with the data.
Table 01: The data that was used to complete the research work
| S/N | Data Type | Source Of Data |
| 1 | Sentinel SAR | Google Earth Engine (GEE) |
| 3 | Sentinel Optical data | Google Earth Engine (GEE) |
| 4 | Administrative boundary shape file | Ghana Statistical Service Website (GSS) |
| 5 | Training Samples | Google Earth pro |
| 6 | Map | ArcGIS |
| 7 | Reports | Microsoft Office |
The whole research used two Sentinel 1 SAR images which were taken from 2022-01-01 through to 2023-08-31 using an SAR image that focused on a single polarization mode (VV) with its orbit property pass in ascending order. Table 02 describes the data qualities as well as the primary characteristics of S-1. Due to the smaller crown size of cocoa, SAR data contributed a temporally consistent data source in the foggy tropical and hilly terrain, and the C-band wavelength of 5.6 cm is more suitable than the L-band sensor, which is normally used to monitor cocoa lands and forests. Sentinel-1 ground data were gathered during the period stated earlier.
Table 02: Main attributes from the Synthetic Aperture Radar (SAR) dataset
| S-1 | Operation | Since 03/04/2014 – Current | SAR DATA | Imaging date | 01/01/2022 |
| Orbit Height | 693km2 | Swath width | 250km2 | ||
| Inclination | 98.18 | sub-Swaths | 3 | ||
| Wavelength | C-Band (3.75-7.5cm) | Incidence angle range | 29.1-46.0 | ||
| Polarization | Dual (VV + VH) | Spatial resolution | 5 x 20m (single look) | ||
| Temporal Resolution | Six days | Pixel Spacing | 2.3 x 17.4 m | ||
The Sentinel 2 data was obtained from the Google Earth Engine (GEE) using the Google Earth Engine Editor (GEEE). Sentinel-2 SR images were obtained for one year, encompassing both the rainy and dry seasons. A filter was applied to all Sentinel scenes to capture images with a cloud cover pixel percentage of less than 10%. This was especially crucial because cloud masking employing heavily cloudy landscapes will almost certainly result in cloud artifacts, which will have an impact on the spectral signal. Two forms of remote sensing data optical data and SAR data were incorporated as predictors for cocoa mapping and classification in multi-sensor technique [28]. The use of data from the GEE platform to acquire 10 m SAR C-band Copernicus Sentinel-1 was used for this project. The data was pre-processed to apply the orbit file which involves the preprocessing method to remove data loss due to the satellite positioning and other information relating to data capture and create a new image with the precise orbit ephemerides applied for Sentinel-1 imagery, Converting digital numbers (DNs) to Backscatter under the metadata available to obtain the required polarization of HV and VV, the individual randomly scatters resolution cells producing the speckle were filtered to produce an image with much data, with the aid of the doppler effect method, the geometric corrections were made to a pixel spacing of 10m [29]. For 10 m optic Sentinel-2 (S2) Surface Reflectance (SR) (Sentinel-2 data [2022-2023] retrieved on 23-06-2023. GEE was used to preprocess and tile association was done to select modules with predefined tiles which intersect the image footprint. Resampling and grid computation were also done to link native to targeted geometry [30]. Resampling of level Geometry was done to resample the spectral band and calculate the TOA. Mask computation was done to generate the cloud mask geometry to cater to cloud areas. All the required band was then compressed to obtain a stack image for further processing [31]. Training samples were picked and used for the classification with the aid of Google Earth Pro and GEE the classification. The reference samples were picked using Google Earth Pro to give a high-resolution of the image. An equal number of 200 samples were picked for each class and used because several prior studies have utilized similar sample sizes with successful outcomes [32]. In the selection mode, the study area map in the form of a Keyhole Markup Language zipped (kmz) extension format was overlayed into the Google Earth Pro. It was then zoomed to the areas and the respective reference scheme was shown. Each reference scheme is selected with the aid of a pin. The pined point of interest will be shown with its Eastings and Northings values which were copied and recorded in a Microsoft Excel template. A total of 1000 samples were picked and used for the research. The various identified collective classes (Cocoa Farms, Forest/vegetation, Settlements, Bare lands, and Water bodies) were further identified with Land Cover Classes. The classes are grouped as Cocoa farms, Forest/vegetation, Settlements, Bare lands, and Water Bodies. The collected map points in Eastings and Northings were converted into Longitude and Latitude and saved in a CSV file format. The CSV file was then converted into a shape file to be read by GEE. The data analysis process is because it gives a detail of how the entire workflow was done. Figure shows the summary of the methods adopted in the research in a methodological flowchart. Data integration is the process of merging two or more datasets for analysis. In this research, Sentinel SAR and Sentinel optical data were integrated to create a unified dataset for the Bekwai District. Google Earth Engine (GEE) was used to perform the integration, resulting in a stack image that represents the Bekwai District. This integrated dataset was used for further analysis in the research. The various bands required for each data was integrated and stacked together to obtain one image. The various image stacking methods which include bicubic interpolation, and Lanczos resampling are best and produce a smoother result but because it is computationally expensive is best to use the neighboring method. The best image stacking method for this project is the nearest neighbor resampling method for the image staking because is a simple algorithm and has efficient computation during the implementation also since it does not create new data, it has the same resolution as the image after computation. Also, because the method enabled me to preserve a local relationship between the pixels in the Sentinel SAR and Sentinel Optical products was deemed best for this analysis. Since it involves two products, the pixel values of both will be used. The pixel value of Sentinel SAR was resampled into the geographical raster of Sentinel Optical [33]. Image segmentation was required to obtain a perfect result. A segmentation approach was used to better group pixels with comparable values. This technique was created only by combining Sentinel SAR and Sentinel Optical products. A neighborhood integrating criterion was used, and a criterion was chosen. To produce a land use land cover map for sentinel SAR, sentinel optical, and the integration of Sentinel SAR and Optical the use of GEE was employed [34]. The Random Forest (RF) classification algorithm was used for the image classification. RF is frequently employed for classifying remote sensing issues due to its resilience to handle large dimension data, and ease of parameterization [35]. The algorithm was validated before executing the final classifications. Calibration required feeding the whole reference data feature of 400 data samples, detecting class confusion, and calculating variable significance data samples. Each Calibrated stage tested several land cover categorization techniques and determined the class target. All of the subsequent phases were created in GEE after the segmentation process. In essence, 1000 random points were designed to be overlapped by segmentation polygons, and these were visually evaluated as belonging to one of the five designated classes. The fundamental building block of a random forest is a decision tree. A random forest consists of a collection of decision trees, each built using a different subset of the data and features. The effective tool for estimating target variables or pattern classification is the decision tree. A decision tree divides the targeted space into parts and assigns each section a value [36]. In simple terms, the answer to the regression problems with the pattern in each area can be determined by the averaged targeted value, in other words, each area is given tasks based on the average of the target values related to the patterns in each area’s learning [25]. In a decision tree, there are a series of ways to determine the exact prediction available for the classification. Different variables are taken into consideration to determine the pattern that exists in the tree. The predicted variables available for classification are readily available to predict the Random Forest (RF) classification which gives the exact prediction and is more effective than other classification models. The variety between the created values and the split values was reduced. Theoretically, Random Forest classification should not have a strong influence on the output but needs to be turned practically [37]. The bootstrapping process is unique and does sample selection on a random basis. Each tree in the selected process is the training sample.
Table 03: Describes the land Cover Classes used for the research
| Land Cover Class | Description |
| Cocoa farms | Areas where cocoa trees are cultivated. It comprises areas where both diseased and healthy cocoa trees are found. |
| Vegetation or forest | Areas covered by natural vegetation (including trees, shrubs, and grasses), forest vegetation, crops such as
(plantains, vegetables, maize, etc) and other crops cultivated. |
| Water bodies | Areas covered by water bodies such as rivers, streams, and ponds. |
| Bare lands | Areas with little to no vegetation cover, such as galamsey sites, and rocky outcrops. |
| Settlements | Areas where citizens live, including buildings of the people living, offices or other buildings,
villages found in the various communities, and any other buildings |
The classified image is created employing the ML technique employed to reclassify the unclassified cells that surround it. The obtained classified map is cleaned utilizing filtering (by removing isolated pixels from the classified image), smoothing of class boundaries (by clumping the classes by smoothing the ragged edges of the classes), and removal of small isolated regions which was not cleaned earlier which will alter the output obtain a more visually appealing map. The classification was done for Sentile-1 SAR, Sentinel-2 optical data, and the integration of SAR and Optical data. The classified image is produced in the form of Land Use Land Cover (LULC) map images which are the supervised classified classes identified and downloaded from Google Drive account as a Tiff file image. The image was then loaded with the aid of ArcMap 10.6 to produce the map package. The ArcMap packages allow for graph presentation.
- RESULT & DISCUSSION
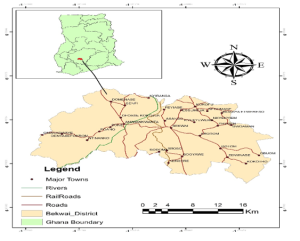
Figure 01: The district map of Bekwai
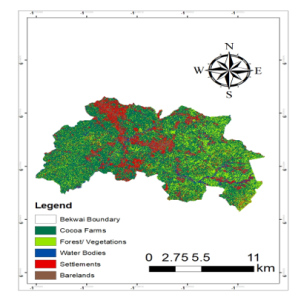
Figure 02: The Land Use Land Cover map produced for the sentinel SAR data
Table 04: Land Area of LULC Classes for Sentinel SAR Data
| LULC Class | Area (Ha) | Percentage (%) |
| Cocoa | 389434.8 | 71.68 |
| Vegetation | 54473.4 | 10.03 |
| Water | 24040.3 | 4.42 |
| Settlement | 58622.7 | 10.79 |
| Bare lands | 16754.4 | 3.08 |
| Total | 543325.6 | 100 |
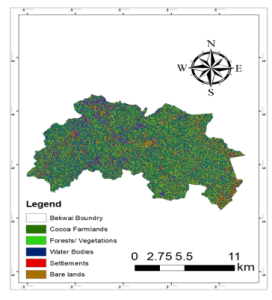
Figure 03: The Land Use Land Cover map produced for the sentinel Optical data
Table 05: Land Area of LULC Classes for Sentinel Optical Data
| LULC Class | Area (Ha) | Percentage (%) |
| Cocoa | 286659.4 | 52.76 |
| Vegetation | 68029.8 | 12.52 |
| Water | 79007.9 | 14.54 |
| Settlement | 56860 | 10.47 |
| Bare lands | 52768.5 | 9.71 |
| Total | 543325.6 | 100 |
It is difficult to differentiate between optical and radar investigations, however the optical and radar signatures for crops growing in April and May disclose the sort of management strategy utilized and reflect the winter plant cover [38]. The classified sentinel satellite imagery for the image of the land cover for Bekwai District found that the cocoa area or farmland covered by cocoa totaled 317398 Ha (58.42%) which is a little over half of the total farmland size. Water bodies depicted a total area of 49703.2 Hectares with a percentage of (9.15%). The vegetation cover populated a total area of 65508.1hectares (12.06%) which is slightly above the area covered by the water bodies. The total area for settlement was 63900.30 Ha (11.76%) which is slightly below the vegetation cover. The area covered by the bare land is the least among the classified areas with 46816 Ha (8.62%) of the total percentage.
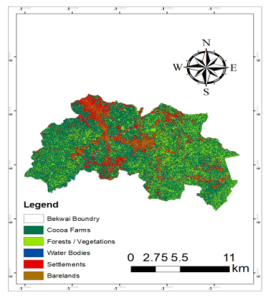
Figure 04: LULC map produced for the integration of sentinel SAR and Optical data
Table 06: Land Area of LULC Classes for Integration of Sentinel SAR and Sentinel Optical Data
| LULC Class | Area (Ha) | Percentage (%) |
| Cocoa | 317398 | 58.42 |
| Vegetation | 65508.1 | 12.06 |
| Water | 49703.2 | 9.15 |
| Settlement | 63900.3 | 11.76 |
| Bare lands | 46816 | 8.62 |
| Total | 543325.6 | 100 |
Table 07: provides a table for the overall accuracy and kappa value
| Method | OA | K |
| Integration of SAR and Optical | 85.14% | 0.87 |
| SAR only | 78.12% | 0.80 |
| Optical only | 81.07% | 0.82 |
LULC change analysis was done to determine the land cover changes that exist between the different satellite images being used. The classified satellite images were used for this purpose such that the sentinel image was employed and the assessment was done using the SAR, Optical, and integration. The change analysis was done to determine the effect of each on the present stage of cocoa production and for decision-making in the Agricultural sector. It is this section that gives the special analysis for the individual classification being done. Not only the cocoa farmlands found on the land but also it was noticed that there are areas where Forests and Vegetation lands are found which was found out that it covers 54473.4 Ha and gives 10.03% of the total land size within the district. The Forests land indicated that there is an area where we have clustered the forest and vegetation region whereas the others are not clustered but occurred in few groups. The clustered portion shows the sacred forest left within the district. Areas where the Forest/ Vegetation zone is not scattered but few show the vegetation region which includes other crops which include maize plantation, beverage crops, palm nut plantation, leaves, and all other green fields. Since decision-making is a factor in our research, other classes are found that play a major role. We also look at the effect of other classes on the cocoa farmlands. There is a red color section or class which shows the settlement area which covers 24,040.3 Ha which equals 10.79% of the total land size. It entails the buildings or areas where living and satisfying human needs can be available. Due to its wide coverage, the map of cocoa areas in Bekwai. The areas occupied by the Forest or vegetation, Bare lands, Water Bodies, and Settlements are also identified. The sizes or areas covered by the classification are also shown in Table 4.2 which showed the results obtained were such that there are enough with a total land size of 286659.4 Ha out of a total of 543325.6 Ha of cocoa farmlands available in the district. It also depicts that the cocoa area sector covers 52.76% of the total land size which means that more than 50% of the land size available in Bekwai district is cocoa area. It explains that the readily available area in Hectares for cocoa production is more than that of the other classes. The cocoa farmlands cover the majority of the area under review. It shows clearly that the cocoa farmlands being viewed have an impact on the district. Not only the cocoa farmlands found on the land but also it was noticed that there are areas where Forests and Vegetation lands are found. It was found that there were 68029.8 Hectares which comprises 12.52% of the total district. This covers the area where only specific vegetations were made up. The Forests land indicated that there is an area where we have clustered the forest and vegetation region whereas the others are not clustered but occurred in few groups. The clustered portion shows the sacred forest left within the district. Areas where the Forest/ Vegetation zone is not scattered but few show the vegetation region which includes other crops which include maize plantation, beverage crops, palm nut plantation, leaves, and all other green fields which comprises fields with green grasses. Bare land had always been a place where most activities have been demolished and left busy and untouched represents the bare land area with a total land size of 52,768.5 Hectares size which represents 9.71% of the total land size of the district and it includes areas where the galamsey site, road lands, lands without any vegetation, and all other areas where any of the classes is been found. Table 02 above shows the area covered by each of the selected classes. It gives the individual sizes covered by each class. It shows that the side which covered many areas is the Cocoa farmland area, followed by the water bodies which cover 14.54% of the total farm size, followed by the Forest and Vegetation zone which covered 12.52% of the total land size, then the size occupied by the Settlement which covered 10.47% of the total size and with the bare lands which come as the class which covered 9.71% of the total size with the least area covered in hectares as explained in the figures and tables above. The categorization accuracy is higher when Sentinel SAR and Sentinel Optical images are combined than when only one sensor is used. Figure shows the Land Use Land Cover Map of Bekwai District which gives a detail of the classes under study. It was shown from the figure that there was a portion which revealed. It shows the arrangement of the cocoa farms which covers almost 60% of the district which means the large area size of the district covers the Cocoa farmlands. The area covered by the Forest and Vegetation also covers 12.06% which is 65508.1 Ha of the total size which was extracted from Figure which gives an area size of the classes in kilometers. The bare land areas are zones with few coverages. Figure shows the Land Use Land Cover map produced for the sentinel Optical data is such that it gives a detail of the areas where the cocoa farmlands were found in figure below. The areas occupied by the Forest or vegetation, Bare lands, Water Bodies, and Settlements are also identified. The sizes or areas covered by the classification are also shown in Table 4.2 which shows the results obtained were such that there are enough farmlands with a total land size of 317398 Ha out of a total of 543,325.6 hectares. It also depicts that the cocoa area sector covers 58.42% of the total land size of the district which means that more than 50% of the land size available in the Bekwai district are cocoa areas. It explains that the readily available area in hectares for cocoa production is more than that of the other classes. The cocoa farmlands cover the majority of the area under review. It shows clearly that the cocoa farmlands being viewed have an impact on the district. Not only the cocoa farmlands found on the land but also it was noticed that there are areas where Forests and Vegetation lands are found. It was found that there were 65,508.1 hectares which comprise 12.06% of the total district. This covers the area where only specific vegetations were made up. The Forests land indicated that there is an area where we have clustered the forest and vegetation region whereas the others are not clustered but occurred in few groups. The clustered portion shows the sacred forest left within the district. Areas where the Forest/ Vegetation zone is not scattered but few show the vegetation region which includes other crops which include maize plantation, beverage crops, palm nut plantation, leaves, and all other green fields which comprises fields with green grasses. Decision-making is a factor in our study; other classes are found that play a major role. There is a red color section or class that shows the settlement area. It was found that the district contained 63,900.3 hectares size of land size which covers about 11.76% of the total land size. It entails the buildings or areas where living and satisfying human needs can be available and other locations like huts, and enclaves that are comfortable for living. The brown sector represents the bare land area with a total land size of 46,816 hectares size which represents 8.62% of the total land size of the district and it includes areas where the galamsey site, road lands, lands without any vegetation, and all other areas where any of the classes is been found. The graph below shows the area covered by each of the selected classes. It gives the individual sizes covered by each class. It shows that the side that covered many areas is class 1 which is the Cocoa farmland area, followed by class 2 which covers the water bodies which cover 9.15% size 49,703.2 hectares of the total farm size, followed by the Forest and Vegetation zone which covered 12.06% which size 65,508.1 hectares of the total land size, then the size occupied by the Settlement which covered 10.47% which size 56,860 hectares of the total size and with the bare lands which comes as the class which covered 8.62% which size 46816 hectares of the total size with the least area covered in hectares as explained in table 03. The classification using the SAR data showed the highest land cover for the cocoa area of 389,434.8 Hectares (71.68%), compared to Optical of 286,659.4 Ha (52.76%) and integrated data of 317,398 Ha (58.42%). This can be attributed to SAR’s ability to penetrate both cloud cover and vegetation canopy enhancing its capability to detect cocoa plants. SAR data classified relatively small areas as water (4.42%) and bare lands (3.08%). SAR is less effective in distinguishing these two classes because of the similarity in backscatter of radar waves reflected by smooth surfaces like water bodies, bare lands, and even certain types of vegetation that are sparse, especially in flat terrains. Challenges in water and Bare land classification highlight the limitations of SAR when dealing with smooth surfaces or areas lacking distinct structural features. SAR data classified moderate areas as vegetation (10.03%) and settlement (10.79%). Optical data resulted in the lowest percentage of cocoa classified (52.76%). This could be due to challenges such as cloud cover or shadows affecting the visibility of cocoa plants. Optical sensors rely on reflected sunlight which may be obstructed in cloudy conditions, affecting classification accuracy. Optical data classified the largest area as water (14.54%) benefiting from its ability to capture spectral signatures specific to water bodies. Similarly, it classified more areas as bare lands (9.71%) compared to SAR utilizing its detailed spectral information for differentiating land cover types. Optical data classified a higher percentage as vegetation (12.52%) compared to SAR. Settlement areas (10.47%) were also accurately classified, reflecting Optical data’s capability to identify built-up areas based on spectral characteristics. Integrated data achieved a higher cocoa percentage cover (58.42%) compared to Optical data alone, but slightly lower than SAR alone. The integration mitigates the limitations of each data type leading to improved classification results. Integrated data also provided balanced classification results for water (9.15%) and bare lands (8.62%) taking advantage of the strengths of both sensors to improve differentiation in flat terrains and spectral reflectance. SAR contributes structural information while spectral differentiation is produced by the Optical data resulting in a more accurate land cover classification. A close land area was obtained for settlement (11.76%) and vegetation (12.06%) which is not so different from the result obtained using SAR data only and Optical data only. Integrated data achieved the highest overall accuracy (85.14%) and Kappa coefficient (0.87), indicating a superior performance compared to SAR alone (OA: 78.12%, K:0.80) and Optical alone (OA: 81.07%, K:0.82). This highlights the effectiveness of integrating SAR and Optical data for improving classification accuracy and mapping of cocoa farms.
- CONCLUSION
The combination of Geographic Information Systems (GIS) and Remote Sensing (RS) is a tool for accurate cocoa, forest, and plant composition mapping for understanding ecosystems’ complex characteristics and monitoring their condition over time. To achieve this, remote sensing technologies have emerged as a valuable tool, particularly with the development of accessible and open-source solutions. This study aimed to investigate the potential of using Sentinel SAR data, Sentinel Optical and combining Sentinel SAR and Sentinel optical data, to classify forest cover and distinguish it from surrounding non-forest areas. Looking at the Sentinel-2 Optical and Sentinel-1 SAR data separately, each had its strengths in mapping cocoa farms. SAR data was particularly good at identifying cocoa because it can penetrate cloud and tree canopies and spot the unique structures of cocoa plants. However, it struggled to tell apart water bodies and areas without much vegetation, like bare lands, because their radar signals look similar. The Sentinel SAR map obtained found that there was some integral information needed for analysis but was not there which yielded a low accuracy result. On the other hand, Optical data was great for detecting water bodies and giving us detailed information about different types of vegetation. Although it sometimes had trouble with cocoa mapping in certain conditions, its spectral ability helped improve upon the results obtained by using SAR only. When the two data were integrated Sentinel-1 SAR with Sentinel-2 Optical data, there was a big improvement in how well cocoa farms could be mapped. By leveraging SAR’s penetrative ability and Optical’s spectral ability, classification could be done more accurately. The integrated approach set a higher standard for precision in identifying cocoa areas, showing how powerful it can be to use different kinds of remote sensing data together. Moreover, comparing the three methods which are, using only Sentinel-1 SAR, only Sentinel-2 Optical, and their integrated data revealed the best method to use. The analysis of the results obtained throughout the study demonstrates that integrating Remote Sensing and GIS is an effective approach to data preparation where the tool enables me to obtain. SAR initially found the most cocoa areas because it could see through dense vegetation. It’s a crucial step forward in improving how we monitor cocoa farms and manage land sustainably. The map for the integration of Sentinel SAR and Sentinel Optical. The LULC map option had the highest accuracy of 85.14% which means it can be used for analysis. It was noticed that the integrated map had the highest accuracy compared to that of the Sentinel Optical which means that it is better to integrate SAR and Optical than to use it individually for LULC maps.
REFERENCES
- Ai, E., Castro, V., Chen, Y., Ortiz, M., & Tailor, A. (2012). Proposal for Enabling Investment in Cocoa Processing Plants in Ghana.
- Ameyaw, G. A., Dzahini-Obiatey, H. K., Domfeh, O., Oppong, F. K., & Abaka-Ewusie, K. (2015). History and Data Analyses of ‘Cutting Out’ Method for Cocoa Swollen Shoot Virus Disease (CSSVD) Control in Ghana. Journal of Plant Diseases and Protection, 122(5), 200–206.
- Anyimah, F. O., Osei Jnr, E. M., & Nyamekye, C. (2021). Detection of stress areas in cocoa farms using GIS and remote sensing: A case study of Offinso Municipal & Offinso North district, Ghana. Environmental Challenges, 4, 100087.
- Ashiagbor, G., Forkuo, E. K., Asante, W. A., Acheampong, E., Quaye-Ballard, J. A., Boamah, P., Mohammed, Y., & Foli, E. (2020). Pixel-based and object-oriented approaches in segregating cocoa from forest in the Juabeso-Bia landscape of Ghana. Remote Sensing Applications: Society and Environment, 19(July), 100349.
- Attipoe, S. G., Jianmin, C., Opoku-Kwanowaa, Y., & Ohene-Sefa, F. (2020). The Determinants of Technical Efficiency of Cocoa Production in Ghana: An Analysis of the Role of Rural and Community Banks. Sustainable Production and Consumption, 23, 11–20.
- Belgiu, M., & Drăgu, L. (2016). Random forest in remote sensing: A review of applications and future directions. ISPRS Journal of Photogrammetry and Remote Sensing, 114, 24–31.
- Bermudez, S., Voora, V., Larrea, C., & Luna, E. (2022). Cocoa prices and sustainability SUSTAINABLE COMMODITIES MARKETPLACE SERIES Market Overview.
- De Luca, G., M. N. Silva, J., Di Fazio, S., & Modica, G. (2022). Integrated use of Sentinel-1 and Sentinel-2 data and open-source machine learning algorithms for land cover mapping in a Mediterranean region. European Journal of Remote Sensing, 55(1), 52–70.
- DeMers, M. N. (2017). Fundamentals of Geographic Information Systems Fourth edition. In John Wiley & Sons, Inc. (Vol. 53, Issue 9).
- Ding, L., & Kinnucan, H. W. (2011). This document is discoverable and free to researchers across the globe due to the work of AgEcon Search . Help ensure our sustainability . Journal of Gender, Agriculture and Food Security, 1(3), 1–22.
- Doaré, F., Ribeyre, F., & Cilas, C. (2020). Genetic and environmental links between traits of cocoa beans and pods clarify the phenotyping processes to be implemented. Scientific Reports, 10(1), 1–6.
- Ershad, M., & Ali, E. (2020). Geographic Information System (GIS): Definition, Development, Applications & Components.
- Essegbey, G. O., & Ofori-Gyamfi, E. (2012). Ghana Cocoa Industry—An Analysis from the Innovation System Perspective. Technology and Investment, 03(04), 276–286.
- Farr, T. G., Rosen, P. A., Caro, E., Crippen, R., Duren, R., Hensley, S., Kobrick, M., Paller, M., Rodriguez, E., Roth, L., Seal, D., Shaffer, S., Shimada, J., Umland, J., Werner, M., Oskin, M., Burbank, D., & Alsdorf, D. E. (2007). The shuttle radar topography mission. Reviews of Geophysics, 45(2).
- Felegari, S., Sharifi, A., Moravej, K., Amin, M., Golchin, A., Muzirafuti, A., Tariq, A., & Zhao, N. (2021a). Integration of sentinel 1 and sentinel 2 satellite images for crop mapping. Applied Sciences (Switzerland), 11(21).
- Felegari, S., Sharifi, A., Moravej, K., Amin, M., Golchin, A., Muzirafuti, A., Tariq, A., & Zhao, N. (2021b). Integration of sentinel 1 and sentinel 2 satellite images for crop mapping. Applied Sciences (Switzerland), 11(21).
- Forkuor, G. (2014). Agricultural Land Use Mapping in West Africa Using Multi-sensor Satellite Imagery. Thesis, 191.
- Gavrilova, N. G. (2021). Contemporary global production and consumption of cocoa: An assessment. IOP Conference Series: Earth and Environmental Science, 839(2).
- Helwig, N. E., Hong, S., & Hsiao-wecksler, E. T. (2021). Population of District and Regions.
- Imperatore, P., Pepe, A., & Sansosti, E. (2021). High performance computing in satellite sar interferometry: A critical perspective. In Remote Sensing (Vol. 13, Issue 23). MDPI.
- James Diebel, Jacob Norda, Orna Kretchmer, J. K. (2023). The Weather Year Round Anywhere on Earth. Cedar Lake Ventures, Inc. 2500 Shadywood Rd Ste 510 Excelsior, MN 55331-6203 United State.
- Joshi, N., Baumann, M., Ehammer, A., Fensholt, R., Grogan, K., Hostert, P., Jepsen, M. R., Kuemmerle, T., Meyfroidt, P., Mitchard, E. T. A., Reiche, J., Ryan, C. M., & Waske, B. (2016). A review of the application of optical and radar remote sensing data fusion to land use mapping and monitoring. Remote Sensing, 8(1), 0–23.
- Kim, M. D., & Morera, G. F. (2017). Document of the World Bank Competitive reinforcement of value chains in Ecuador.
- Knudsen, M. H., & Fold, N. (2011). Land distribution and acquisition practices in Ghana’s cocoa frontier: The impact of a state-regulated marketing system. Land Use Policy, 28(2), 378–387. https://doi.org/10.1016/J.LANDUSEPOL.2010.07.004
- Kuusaana, M., Adu-Gyamfi, S., & Darkwa, B. (2021a). Cocoa Production in Ghana (1879-1976). Studia Historiae Oeconomicae, 39, 55–76.
- Kuusaana, M., Adu-Gyamfi, S., & Darkwa, B. (2021b). Cocoa Production in Ghana (1879-1976). Studia Historiae Oeconomicae, 39, 55–76.
- Kwaw-Nimeson, E., & Tian, Z. (2019). Impact Assessment of the Cocoa Rehabilitation Project on Cocoa Exports in Ghana. Open Journal of Social Sciences, 07(09), 207–219.
- Li, C., Ma, Z., Wang, L., Yu, W., Tan, D., Gao, B., Feng, Q., Guo, H., & Zhao, Y. (2021). Improving the Accuracy of Land Cover Mapping by Distributing Training Samples. Remote Sensing, 13(22).
- Li, E., Samat, A., Liu, W., Lin, C., & Bai, X. (2019). High-resolution imagery classification based on different levels of information. Remote Sensing, 11(24).
- Maria Bruna Zolin Graduand Gideon Kwasi Animah. (2019). Single Cycle Degree programme in Economics and Management Final Thesis Title The Ghanaian Cocoa Market; Actors and Policies.
- Mirza, A., Shaikh, N., Shaikh, P. A., & Jamali, S. K. (2016). Trends and analysis of Pakistan’s cash crops export during. In International Journal of Development and Sustainability (Vol. 5, Issue 5).
- Mohammad Yazdi Pusadan, Syahrullah, Merry, & Ahmad Imam Abdullah. (2022). k-Nearest Neighbor and Feature Extraction on Detection of Pest and Diseases of Cocoa. Jurnal RESTI (Rekayasa Sistem Dan Teknologi Informasi), 6(3), 471–480.
- Mohammed, A. K. (2015). The politics of municipal fragmentation in Ghana. Commonwealth Journal of Local Governance, 168–189.
- Mohammed, I., Marshall, M., de Bie, K., Estes, L., & Nelson, A. (2020). A blended census and multiscale remote sensing approach to probabilistic cropland mapping in complex landscapes. ISPRS Journal of Photogrammetry and Remote Sensing, 161, 233–245.
- Monastyrnaya, E., Joerin, J., Dawoe, E., & Six, J. (2016). Assessing the resilience of the cocoa value chain in Ghana. www.resilientfoodsystems.ethz.ch,
- Murat ERTUGRUL H. (2021). E-ICEESS_2021_02092021-edit.
- Okyere, E., & Mensah, A. C. (2016). Cocoa production in Ghana: trends and volatility. International Journal of Economics, Commerce and Management, 5 (3), IV(3), 462–471.
- Pakrashi, A., Namee, B. Mac, Torgo, L., Krawczyk, B., Branco, P., & Moniz, N. (2017). Stacked-MLkNN: A stacking based improvement to Multi-Label k-Nearest Neighbours. In Proceedings of Machine Learning Research (Vol. 74).
Publication History
Submitted: October 31, 2024
Accepted: November 22, 2024
Published: March 31, 2025
Identification
D-0598
DOI
https://doi.org/10.71017/djnsi.4.5.d-0598
Citation
Henry Spio Abakah (2025). Integration of Sentinel SAR and Optical Data for Cocoa Mapping in Ghana: Bekwai District as Case Study. Dinkum Journal of Natural & Scientific Innovations, 4(05):313-326.
Copyright
© 2025 The Author(s).