

")
Publication History
Submitted: March 09, 2025
Accepted: March 28, 2025
Published: March 31, 2025
Identification
D-0414
DOI
https://doi.org/10.71017/djmi.4.3.d-0414
Citation
Sagun Baral (2025). Evaluation of Predictors of Outcome in Patients with Tubercular Meningitis. Dinkum Journal of Medical Innovations, 4(03):81-103.
Copyright
© 2025 The Author(s).
81-103
Evaluation of Predictors of Outcome in Patients with Tubercular MeningitisOriginal Article
Sagun Baral 1*
- Post Graduate, Institute of Medical Education and Research, India.
* Correspondence: sagunbaral01@gmail.com
Abstract: Tubercular Meningitis (TBM) is a common Central Nervous System (CNS) infection in India and is a serious public health issue that results in significant morbidity and mortality. As per the Index TB Guidelines, TBM constitutes 1% of all cases of TB and has been associated with a poor neurological outcome. This study focused on the various outcome predictors as well as the credibility of the MASH-P scoring system in the prediction of 6-month mortality and possible outcomes in patients with tubercular meningitis. Early prognostication can be beneficial in changing the course of the disease itself. A prospective observational study was done for a period of one and a half years. All medical units of the Post Graduate Institute of Medical Education and Research, Chandigarh are included. All tubercular meningitis patients admitted in medical wards and sub-specialties (Emergency, Internal Medicine, Intensive care) as per the Lancet consensus criteria will be enrolled in the present study after obtaining informed consent. A total of N=50 individuals were included in our study, average age in our group was 33.18 ± 14.05 years, and the gender ratio was 1.7:1 (F:M). The majority (74%) of patients were classified under stage 3 Tuberculous Meningitis (TBM). The mortality rate within the study cohort was 46%, predominantly observed among those with stage 3 TBM. The majority (74%) of patients were classified under stage 3 Tuberculous Meningitis (TBM). The mortality rate within the study cohort was 46%, predominantly observed among those with stage 3 TBM. Regarding clinical parameters, symptoms such as blurred vision, loss of appetite, and motor deficit at the initial presentation exhibited a noteworthy correlation with mortality. Additionally, the presence of papilledema, TBM severity, and the occurrence of hydrocephalus, infarct, and tuberculoma on MRI were linked to mortality. Moreover, MASH-P scores demonstrated a correlation with mortality. These associations were determined on univariate analysis. However, in the multivariate regression analysis, none of the parameters demonstrated statistical significance.
Keywords: predictors, outcome, tubercular meningitis, MASH-P
- INTRODUCTION
Tubercular Meningitis (TBM) is a common Central Nervous System (CNS) infection in India and is a serious public health issue that results in significant morbidity and mortality. As per the Index TB Guidelines, TBM constitutes 1% of all cases of TB and has been associated with a poor neurological outcome [1]. Tubercular Meningitis is an acute or sub-acute disease but can present as chronic meningitis with symptoms expanding over days to weeks. In the prodromal phase, patients have non-specific complaints like malaise, myalgia, fatigue, and fever. In the meningitis state, patients usually present with symptoms like fever, headache, vomiting, neck rigidity, photophobia, and altered mental state with or without focal neurological deficits [2]. If the disease remains untreated or doesn’t respond to medical therapy, the disease may progress and may lead to coma and death. Of few who survive, devastating neurological sequelae like hydrocephalus, epilepsy, mental retardation, hemiparesis, or blindness in isolation or combination is seen [3]. Various prognostication factors have been identified for TBM. MASH-P, an Acronym for Modified Barthel Index, Age, Stage, hydrocephalus, and papilledema is a simple prognostic bedside score devised for the prediction of 6-month mortality in patients with TB meningitis [4]. The Modified Barthel ADL Index looks at the activities of daily living in individuals living with disabilities and categorizes the level of disability numerically. Ophthalmological Involvement, specifically vision loss has a devastating impact on the quality of life of TBM patients. Papilledema is one of the common fundus abnormalities seen in TBM patients. The stage of disease at which the patient present to the clinician has prognostic importance with patients presenting at a higher stage of disease having a poor prognosis [5]. The age of the patient is another important prognostic indicator with the elderly population generally having a poorer prognosis compared to the young ones. Hydrocephalus is neurological sequelae of TB Meningitis portending a grave outcome. Tuberculosis is a serious public health issue in the modern-day world bearing a significant impact on quality of life and resulting in significant morbidity and mortality. As per the WHO TB statistics for India for 2021 incidence of TB in India is 2,590,000 million cases which corresponds to a rate of 188 per 100,000 population [3]. Mycobacterium Tuberculosis (M. Tb), the causative agent of tuberculosis, enters the body when one inhales the infectious droplets containing the aerosolized bacteria into the alveolar spaces [6]. Then it crosses the lung epithelium and infects the lung alveolar macrophages, dendritic cells, and neutrophils. Once into the lung, inflammatory processes initiate which either result in a granuloma formation encapsulating infected cells and resulting in latent infection or cases of immunocompromised, elderly, and young, the inflammatory process progresses to active primary TB and results in lung tissue destruction and dissemination to various body organ systems including CNS. Various mechanisms have been proposed by which bacilli migrate into the blood or lymphatic system from the lung alveoli [7]. The CNS is protected from bloodstream-transmitted infectious bacteria by 2 vascular barriers; the blood-brain barrier (BBB) and the blood-cerebrospinal fluid barrier (BCSFB). Via various intrinsic structural proteins, it crosses these barriers and reaches the brain. Once in the brain, limited local immunity permits survival, replication, and development of silent tubercular lesions. Rich and Mc Cordock conducted postmortem studies which discovered that the Rich focus, located under the cortical pia or adjacent to the meninges or ventricles, can rupture and release M. tb bacilli into the subarachnoid space leading to a granulomatous infection of the meninges and the subsequent induction of inflammation initiating tubercular meningitis [8]. Tubercular meningitis can often have a non-specific presentation and laboratory results can also be inconclusive posing a great diagnostic dilemma. Initially, there is a prodromal phase with features such as fever, myalgia, malaise, and fatigue and this phase usually lasts for 2-4 weeks. If followed by the meningitis state, a person develops a fever, neck stiffness, vomiting, and photophobia. Without treatment, several complications arise like cranial nerve palsies; mainly the sixth cranial nerve (Abducens Nerve) and less commonly the third cranial nerve (oculomotor nerve). Hydrocephalus may occur secondary to disturbances in CSF circulation. Direct inflammatory involvement of the brain parenchyma and meninges or vasculitis resulting in infarction causes parenchymal damage. Deficits such as altered consciousness, hemiparesis, aphasia, and hemianopsia can occur due to parenchymal damage. About 10-15% of patients with tubercular meningitis develop seizures. Hyponatremia isa common occurrence due to renal salt wasting syndrome or SIADH. As the disease state progresses, focal neurological deficits are additive; an altered mental state with confusion and coma ensues and eventually has a fatal outcome within 4-8 weeks of onset [9]. The diagnosis of tubercular meningitis includes clinical, laboratory, and radiological parameters. Over the years various diagnostic criteria have been used among which the Modified Ahuja’s Criteria [10] and the Lancet Consensus Criteria [11] are primarily followed which take into account all the three above-mentioned parameters. The diagnosis of TB Meningitis by various methods has its sensitivity and specificity. The sensitivity of detection of TB bacilli by Ziehl–Neilson technique is 10-20%. Nucleic acid amplification tests like Gene-Xpert which can also detect rifampicin resistance-associated mutations are 60% sensitive and almost 100% specific. In addition to this CSF Interferon gamma release assays and CSF ADA levels can also be used. CSF ADA values greater than 8 have a sensitivity of more than 96% and a specificity of less than 59%. CT Brain features have a high specificity of more than 95% which might be missing in the acute stage of the disease True Nat® MTB, MTB RIF Dx, and MTB PLUS (Molbio Diagnostics from Goa, India, referred to as “True Nat”) are emerging new molecular assays in India. The tests for initial diagnosis of tuberculosis are MTB and MTB Plus assays whereas for rifampicin resistance in patients with positive initial diagnostic tests, MTB-RIF Dx assay is used [12]. This study focused on the various outcome predictors as well as the credibility of the MASH-P scoring system in the prediction of 6-month mortality and possible outcomes in patients with tubercular meningitis. Early prognostication can be beneficial in changing the course of the disease itself. In a resource-constrained setting, simple prognostic scores can help predict the prognosis of the patient, explaining the prognosis to the patient’s relatives and prioritizing the need for intensification of therapies in high-risk patients.
- MATERIALS & METHOD
A prospective observational study was done for a period of one and a half years. All medical units of the Post Graduate Institute of Medical Education and Research, Chandigarh are included. All tubercular meningitis patients admitted in medical wards and sub-specialties (Emergency, Internal Medicine, Intensive care) as per the Lancet consensus criteria will be enrolled in the present study after obtaining informed consent and Sample size was 50. The study is based on a prospective collection of data of patients aged older than 18 years, admitted at PGIMER, Chandigarh. The study was done in department of Neurology in collaboration with department of Internal Medicine, Microbiology and Radiodiagnosis. Tubercular meningitis patients who fulfilled the Lancet Consensus Criteria and all the inclusion/exclusion criteria were enrolled in the study. Informed consent was taken from the patient or next of kin. Various demographic, clinical, laboratory and imaging parameters about the patient was collected. At initial evaluation, detailed history and demographic details of the patient was taken. Inquiry was made about the functional status and the level of disability of the patient from the patient attendant using the Modified Barthel Index questionnaire and a numerical score was calculated. Consciousness level was assessed using the Glasgow Coma scale (GCS) and TBM severity was classified as per Annexure 3. Clinical examination was done including the examination of the fundus by ophthalmoscopy for the presence of papilledema. Papilledema was defined as either present or absent. Their cerebrospinal fluid (CSF) was collected and the collected CSF sample was sent to the Department of Microbiology, PGIMER for microbiological-based diagnosis for TBM by GeneXpert Ultra method. Other CSF parameters such as cell count, protein, glucose, cytology, and Gram stain/ Culture Sensitivity was noted. The patient underwent brain imaging in the form of non-contrast CT head at admission followed by CE-MRI brain. CE-MRI Brain was done in all patients at baseline, 1 month, 3 months, and 6 months or as needed. The following parameters were assessed in the MRI:
Meningitis: Location of meningeal inflammation (Basal/ Convexly/ Diffuse)
Presence of Exudate: (Yes/ No)
Hydrocephalus: (Yes/No) (Mild/ Moderate/ Severe)
Infarcts: (Yes/No) (Territory)
Tuberculomas: (Yes/No)
MASH-P scores were calculated at baseline, 1-month, 3-month, and 6-month duration to assess the outcome. Follow-up of the patients was done till completion of treatment in TBM clinic & medicine emergency as per clinical status of the patient on follow-up. Data is entered in an MS Excel sheet after collection from the study participants. The data is standardized for statistical analysis by cleaning it for data entry-related errors, logical checks, etc. The cleaned data is exported to SPSS software for carrying out further analysis. Descriptive statistics will be reported in tabular and graphical displays. Continuous data is reported with mean and standard deviation or median interquartile range as per the validation of the assumption of data. The categorical data is reported with frequencies and percentages. Bar charts, pie charts, or box plots are used for the graphical display of categorical and continuous data. The univariable (Bi-variable analysis) for continuous data is reported using a t-test and analysis of variance for two and three groups, respectively. The categorical data is analyzed using Mann-Whitney for 2 groups and Kruskal-Wallis for 3 or more groups. After bivariate analysis, a multivariable model using regression technique will be applied. The variable with p<0.1 in bivariate analysis will be used to select the variable for multivariable analysis. A two-tailed p-value<0.05 will be utilized for all the analyses. The 95% CI along with the p-value will be reported wherever possible. The sample size was calculated to be 36 with baseline data taken from a study by [2].
Patients’ participation was fully voluntary, with no element of coercion. Prior to enrolment in the study, each patient or patient’s family are provided with informed consent. All study-related information is provided. The study subjects’ confidentiality was preserved.
- RESULTS & DISCUSSION
The total sample size was 50. The mean age (years) in our cohort was 33.18 ± 14.05. 18 (36.0%) patients were male whereas 32 (64.0%) were female, F:M was 1.7 (table 1). 32 (64%) of the patients were classified as having definite TBM while 18 (36%) as highly probable TBM and none of the patient was in the category of possible TBM.
Table 01: Table showing demographic distribution of the patients.
| Age/Gender | Mean ± SD/ Median (IQR)/ Min-Max/ n (%) |
| Age (Years) | 33.18 ± 14.05/ 28.00 (24.00-38.75)/ 18.00 – 70.00 |
| Gender | |
| Male | 18 (36.0%) |
| Female | 32 (64.0%) |
Table 02: Diagnosis of the patients.
| Diagnosis of TBM | Frequency | Percentage |
| Definite | 32 | 64.0% |
| Highly Probable | 18 | 36.0% |
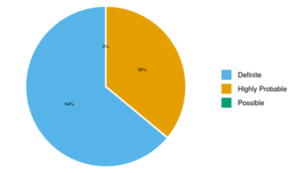
Figure 01: Distribution of Diagnosis of TBM
The stage of TBM during various points of time. At baseline, 8.0% of patients were in TBM Grade 1, 18.0% had Grade 2 TBM, and 74.0% had Grade 3 disease. After 1 month, 41.3% had Grade 1, 6.5% had Grade 2, and 52.2% had Grade 3. At 3 months, 89.3% had Grade 1, 7.1% had Grade 2, and 3.6% had Grade 3. Finally, at 6 months, 88.9% had Grade 1, 7.4% had Grade 2, and 3.7% had Grade 3 in the Severity of TBM.
Table 03: Table showing stage of TBM at baseline, 1 month, 3 months and 6 months.
| Stage of TBM | Grade 1 | Grade 2 | Grade 3 |
| Baseline | 4 (8.0%) | 9 (18.0%) | 37 (74.0%) |
| 1 Month | 19 (41.3%) | 3 (6.5%) | 24 (52.2%) |
| 3 Months | 25 (89.3%) | 2 (7.1%) | 1 (3.6%) |
| 6 Months | 24 (88.9%) | 2 (7.4%) | 1 (3.7%) |
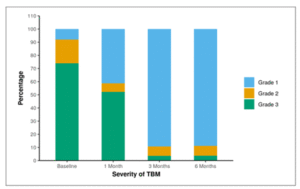
Figure 02: Table showing stage of TBM at baseline, 1 month, 3 months and 6 months.
Table 04 describes various clinical characteristics of the patients. Fever was present in 47 patients (94.0%), while 42 patients (84.0%) reported headaches. Nausea and vomiting were present in 34 patients (68.0%), and 37 patients (74.0%) exhibited altered mental status (AMS). Seizures were documented in 10 patients (20.0%), with 5 patients (10.0%) reporting blurring of vision. Diplopia was complained by 4 patients (8.0%) with documented ptosis in 5 patients (10.0%). Among systemic symptoms, 10 patients (20.0%) had loss of appetite (LOA), 10 patients (20.0%) had loss of weight (LOW). Facial Deviation was noted in 8 patients (16.0%), neck rigidity in 36 patients (72.0%), Kernig’s sign tested positive in 30 patients (60.0%), and ataxia was evident in 5 patients (11%).
Table 04: Table describing various clinical symptoms and signs of the patients.
| Clinical Features | n (%) |
| Fever | 47 (94.0%) |
| Headache | 42 (84.0%) |
| Nausea and Vomiting | 34 (68.0%) |
| Altered sensorium | 37 (74.0%) |
| Seizure | 10 (20.0%) |
| Blurring of Vision | 5 (10.0%) |
| Diplopia | 4 (8.0%) |
| Ptosis | 5 (10.0%) |
| Loss of appetite | 10 (20.0%) |
| Loss of weight | 10 (20.0%) |
| Facial deviation | 8 (16.0%) |
| Neck rigidity | 36 (72.0%) |
| Kernig’s sign | 30 (60.0%) |
| Ataxia | 5 (11.0%) |
| Extrapyramidal signs | 0 (0.0%) |
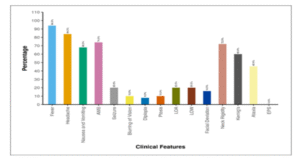
Figure 03: Figure showing distribution of clinical symptoms and signs of the patients at baseline.
Table 05 describes the motor deficits at baseline. Motor deficits were observed in 15 patients (30.0%). Specifically, 6 patients (12.0%) had hemiparesis, 4 patients (8.0%) had paraparesis, and 5 patients (10.0%) experienced quadriparesis. Additionally, sensory disturbances were reported in 5 patients (10.0%) (table 05).
Table 05: Table showing focal neurological deficits at baseline.
| Focal neurological deficits | n (%) |
| Weakness (Presentation) | |
| None | 35 (70.0%) |
| Hemiparesis | 6 (12.0%) |
| Paraparesis | 4 (8.0%) |
| Quadriparesis | 5 (10.0%) |
| Sensory Loss | |
| Intact/CNBA | 45 (90.0%) |
| Impaired | 5 (10.0%) |
Table 06 and Figure 04 show the distribution of cranial nerve palsy at baseline. Cranial nerve palsy was identified in 40% of patients, some of whom exhibited multiple cranial nerve palsies, including Cranial Nerves 3, 6, 7, and 12. Specifically, 30.0% of participants had Sixth Cranial Nerve Palsy, 20.0% had Third Cranial Nerve Palsy, 16.0% had Seventh Cranial Nerve Palsy, and 2.0% had Twelve Cranial Nerve Palsy.
Table 06: Table showing distribution of cranial nerve palsy at baseline
| Cranial Nerve Palsy | Present n (%) | |
| None | 30 (60.0%) | |
| Sixth Cranial Nerve | 15 (30.0%) | |
| Third Cranial Nerve | 10 (20.0%) | |
| Seventh Cranial Nerve | 8 (16.0%) | |
| Twelve Cranial Nerve | 1 (2.0%) |
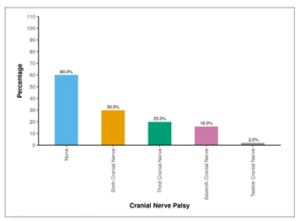
Figure 04: Figure showing distribution of cranial nerve palsy at baseline
Table 07 and Figure 05 show the distribution of papilledema over 6 months. At the baseline, 40.0% of the participants exhibited the presence of papilledema. One month later, 38.0% still had papilledema, and at both the 3-month and 6-month marks, 2.0% of participants continued to show the presence of papilledema.
Table 07: Table showing distribution of papilledema over 6 months
| Papilledema | Present n (%) | |
| Baseline | 20 (40.0%) | |
| 1 Month | 19 (38.0%) | |
| 3 Months | 1 (2.0%) | |
| 6 Months | 1 (2.0%) |
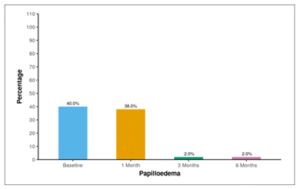
Figure 05: Figure showing distribution of papilledema over 6 months
Among the participants, 86.0% did not exhibit Extra Neural TB. In contrast, 2.0% had Bone TB and 12.0% had Pulmonary TB.
Table 08: Table showing distribution of Extra-neural TB.
| Extra Neural TB | Frequency | Percentage |
| None | 43 | 86.0% |
| Bone TB | 1 | 2.0% |
| Pulmonary TB | 6 | 12.0% |
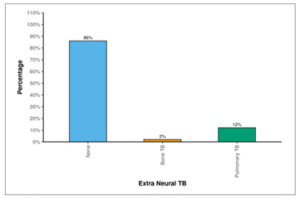
Figure 06: Figure showing distribution of Extra-neural TB.
Figure 07 shows the distribution of co morbidities and addictions in patients. 2 participants (4.0%) had DM. Additionally, 2 participants (4.0%) exhibited HTN, 1 participant (2.0%) had HIV, and 1 participant (2.0%) had malignancy. Alcohol use was reported in 6 participants (12.0%), and 5 participants (10.0%) were present smokers. Furthermore, 1 participant (2.0%) had a history of old CVA. None of the participants (0.0%) showed the presence of CAD, Thyroid disorders, HBV, or HCV.
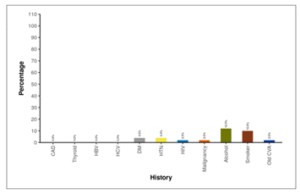
Figure 07: Figure showing distribution of co morbidities and addictions in patients.
Table 08 shows the biochemical parameters of patients. The average Hemoglobin level was 10.91 ± 1.95 g/dL. The mean Sodium concentration in serum was 131.12 ± 7.42 m Eq/L. The average Serum Creatinine level was 0.62 ± 0.40 mg/dL. The mean Aspartate Aminotransferase (AST) activity was 71.00 ± 127.01 U/L. The Alanine Aminotransferase (ALT) activity had a mean value of 78.74 ± 132.40 U/L. The mean Total Bilirubin concentration was 0.69 ± 0.46 mg/dL, and the Direct Bilirubin mean was 0.39 ± 0.45 mg/dL. Additionally, the mean C reactive protein (CRP) level was 48.67 ± 62.80 mg/L.
Table 09: Table showing biochemical parameters of patients.
| Investigations | Mean ± SD | Median (IQR) | Min – Max |
| Haemoglobin (g/dL) | 10.91 ± 1.95 | 11.00 (9.30-12.35) | 4.8 – 15.0 |
| S. Sodium (m Eq/L) | 131.12 ± 7.42 | 131.00 (128.00-136.00) | 114.0 – 145.0 |
| S. Creatinine (mg/dL) | 0.62 ± 0.40 | 0.55 (0.40-0.70) | 0.3 – 2.6 |
| AST (U/L) | 71.00 ± 127.01 | 35.50 (20.25-58.00) | 13.0 – 813.0 |
| ALT (U/L) | 78.74 ± 132.40 | 40.00 (18.00-82.00) | 5.0 – 750.0 |
| Total Bilirubin (mg/dL) | 0.69 ± 0.46 | 0.60 (0.40-0.90) | 0.2 – 2.7 |
| Direct Bilirubin (mg/dL) | 0.39 ± 0.45 | 0.20 (0.14-0.40) | 0.0 – 2.6 |
| CRP (mg/L) | 48.67 ± 62.80 | 27.50 (8.22-57.00) | 1.1 – 270.0 |
Table shows the CSF parameters of patients. The average cerebrospinal fluid (CSF) count was 368.02 ± 606.91 cells/mm³. The mean percentage of CSF neutrophils was 24.36 ± 22.80%, while the mean percentage of CSF lymphocytes was 75.10 ± 23.13%. The average CSF protein concentration was 263.84 ± 344.18 mg/dL, and the mean CSF glucose level was 40.16 ± 26.79 mg/dL. All participants (100.0%) had a sterile CSF culture. Additionally, 64.0% of participants tested positive for GeneXpert. India Ink was negative for all patients.
Table 10: Table showing CSF parameters of patients.
| CSF | Mean ± SD || Median (IQR) || Min-Max OR N (%) |
| CSF Count (/mm³) | 368.02 ± 606.91 || 220.00 (84.00-343.25) || 2.00 – 3800.00 |
| CSF Neutrophils (%) | 24.36 ± 22.80 || 15.00 (8.25-30.00) || 0.00 – 76.00 |
| CSF Lymphocytes (%) | 75.10 ± 23.13 || 85.00 (64.75-90.75) || 23.00 – 100.00 |
| CSF Protein (mg/dL) | 263.84 ± 344.18 || 185.00 (118.50-252.50) || 54.00 – 2310.00 |
| CSF Glucose (mg/dL) | 40.16 ± 26.79 || 32.00 (20.25-57.00) || 8.00 – 114.00 |
| CSF Culture (Sterile) | 50 (100.0%) |
| GeneXpert (Positive) | 32 (64.0%) |
| India Ink (Positive) | 0 (0.0%) |
Table 11 shows the location of leptomeningeal enhancement at baseline. At baseline, leptomeningeal enhancement was diffuse in 80.0% of the participants, located at the basal area in 14.0% of participants, and at the convex region in 6.0% of participants.
Table 11: Table showing distribution of site of leptomeningeal enhancement at baseline.
| Location of Meningitis (Baseline) | Frequency | Percentage | 95% CI |
| Diffuse | 40 | 80.0% | 65.9% – 89.5% |
| Basal | 7 | 14.0% | 6.3% – 27.4% |
| Convex | 3 | 6.0% | 1.6% – 17.5% |
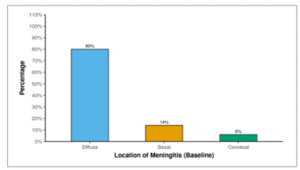
Figure 08: Figure showing distribution of site of leptomeningeal enhancement at baseline.
Table 12 and Figure 9 show the frequency of exudates at baseline. At baseline, 92.0% of the participants had exudates, and this proportion decreased to 78.0% after 1 month. By 3 months, 22.0% of the participants still had exudates, and at 6 months, the presence of exudates was observed in 12.0% of the participants.
Table 12: Table showing frequency of exudates through 6 months follow-up.
| Exudates | Present |
| Baseline | 46 (92.0%) |
| 1 Month | 39 (78.0%) |
| 3 Months | 11 (22.0%) |
| 6 Months | 6 (12.0%) |
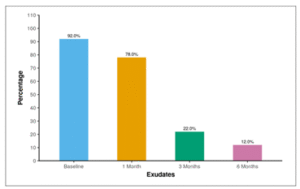
Figure 09: Figure showing frequency of exudates through 6 months follow-up.
Table 13 and Figure 10 show the distribution of hydrocephalus through 6 months follow-up. At baseline, 30.0% of participants exhibited mild hydrocephalus, 16.0% had moderate hydrocephalus, and 10.0% had severe hydrocephalus. After 1 month, 16.0% had mild hydrocephalus, 6.0% had moderate hydrocephalus, and 34.0% had severe hydrocephalus. By 3 months, 6.0% had mild hydrocephalus, 2.0% had moderate hydrocephalus, and 6.0% had severe hydrocephalus. At 6 months, 6.0% had mild hydrocephalus, none had moderate hydrocephalus, and 2.0% had severe hydrocephalus.
Table 13: Table showing distribution of hydrocephalus through 6 months follow-up.
| Hydrocephalus | None | Mild | Moderate | Severe |
| Baseline | 22 (44.0%) | 15 (30.0%) | 8 (16.0%) | 5 (10.0%) |
| 1 Month | 22 (44.0%) | 8 (16.0%) | 3 (6.0%) | 17(34.0%) |
| 3 Months | 43 (86.0%) | 3 (6.0%) | 1 (2.0%) | 3 (6.0%) |
| 6 Months | 46 (92.0%) | 3 (6.0%) | 0 (0.0%) | 1 (2.0%) |
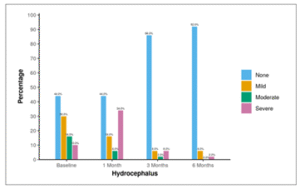
Figure 10: Figure showing distribution of hydrocephalus through 6 months follow-up.
Table 14 and figure 11 show the frequency of ACA infarct through 6 months follow-up. At baseline, 10.0% of participants had the presence of an infarct in the anterior cerebral artery (ACA) territory. This proportion was consistent at 1 month (12.0%). After 3 months, 2.0% still had ACA infarct, and the same was observed at 6 months (2.0%).
Table 14: Table showing frequency of ACA infarct through 6 months follow-up.
| Location of Infarct: ACA | Present n (%) |
| Baseline | 5 (10.0%) |
| 1 Month | 6 (12.0%) |
| 3 Months | 1 (2.0%) |
| 6 Months | 1 (2.0%) |
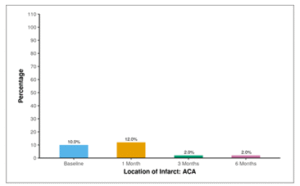
Figure 11: Figure showing frequency of ACA infarct through 6 months follow-up.
Table 15 and Figure 12 show the frequency of MCA infarct through 6 months follow-up. At baseline, 40.0% of participants exhibited the presence of an infarct in the middle cerebral artery (MCA). This percentage remained consistent at 1 month (38.0%). After 3 months, 4.0% still had MCA infarct, and the same was observed at 6 months (2.0%).
Table 15: Table showing frequency of MCA infarct through 6 months follow-up
| Location of Infarct: MCA | Present n (%) |
| Baseline | 20 (40.0%) |
| 1 Month | 19 (38.0%) |
| 3 Months | 2 (4.0%) |
| 6 Months | 1 (2.0%) |
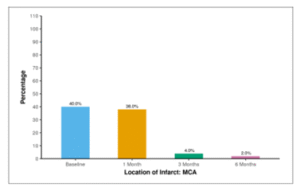
Figure 12: Figure showing frequency of MCA infarct through 6 months follow-up.
Table 16 and Figure 12 shows the frequency of PCA infarct through 6 months follow-up at baseline, 8.0% of participants had the presence of an infarct in the posterior cerebral artery (PCA). This proportion remained consistent at 1 month (8.0%). After 3 months, 4.0% still had PCA infarct, and the same was observed at 6 months (2.0%).
Table 16: Table showing frequency of PCA infarct through 6 months follow-up
| Location of Infarct: PCA | Present n (%) |
| Baseline | 4 (8.0%) |
| 1 Month | 4 (8.0%) |
| 3 Months | 2 (4.0%) |
| 6 Months | 1 (2.0%) |
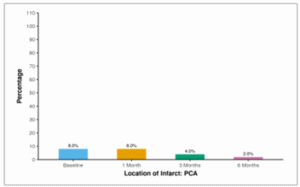
Figure 13: Figure showing frequency of PCA infarct through 6 months follow-up.
Table 17 and Figure 14 show the distribution of Tuberculomas through 6 months follow-up. At baseline, half of the participants (50.0%) exhibited the presence of Tuberculomas. This percentage increased to 70.0% at 1 month, with 34.0% still having Tuberculomas at 3 months. By 6 months, 28.0% of participants retained the presence of Tuberculomas.
Table 17: Table showing prevalence of Tuberculomas through 6 months follow-up
| Tuberculoma | Present n (%) |
| Baseline | 25 (50.0%) |
| 1 Month | 35 (70.0%) |
| 3 Months | 17 (34.0%) |
| 6 Months | 14 (28.0%) |
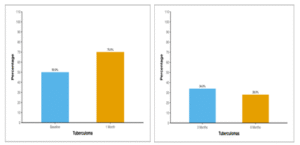
Figure 14: Figure showing prevalence of tuberculomas through 6 months follow-up.
Table 18 and Figure 15 show the mean Modified Barthel Index (MBI) of patients over 6 months follow-up. The average MBI (Baseline) was 1.84 ± 4.43. After 1 month, the mean MBI increased to 8.41 ± 9.24. At 3 months, the mean MBI further increased to 15.75 ± 7.02, and by 6 months, it reached 17.33 ± 5.63.
Table 18: Table showing mean Modified Barthel Index (MBI) of patients over 6 months follow-up.
| MBI | Mean ± SD | Min – Max |
| Baseline | 1.84 ± 4.43 | 0.0 – 16.0 |
| 1 Month | 8.41 ± 9.24 | 0.0 – 20.0 |
| 3 Months | 15.75 ± 7.02 | 0.0 – 20.0 |
| 6 Months | 17.33 ± 5.63 | 0.0 – 20.0 |
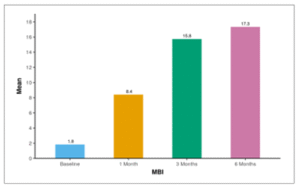
Figure 15: Figure showing mean Modified Barthel Index (MBI) of patients over 6 months follow-up.
Table 19: Table showing change in Modified Barthel Index (MBI) of patients over 6 months period.
| Timepoint | Friedman Test | |||
| Mean (SD) | Range | χ2 | P Value | |
| Baseline | 1.84 (4.43) | 0.00 – 16.00 | 64.1 | <0.001 |
| 1 Month | 8.41 (9.24) | 0.00 – 20.00 | ||
| 3 Months | 15.75 (7.02) | 0.00 – 20.00 | ||
| 6 Months | 17.33 (5.63) | 0.00 – 20.00 | ||
Non-parametric tests (Friedman test) were used to make statistical inferences as data were not normally distributed. Friedman test was used to explore whether the MBI changed significantly over time. The mean MBI increased from a minimum of 1.84 at the Baseline time point to a maximum of 17.33 at the 6 Months. This change was statistically significant (Friedman Test: χ2 = 64.1, p = <0.001).
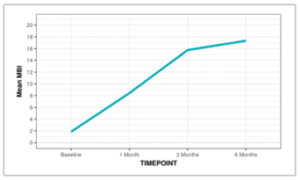
Figure 16: Line diagram depicting the change in MBI over time.
The Box-and-Whisker plot below depicts the distribution of MBI over different time points. In each box, the middle horizontal line represents the median MBI, the upper and lower bounds of the box represent the 75th and the 25th centile of MBI respectively, and the upper and lower extent of the whiskers represent the Tukey limits for MBI at each of the timepoints respectively.
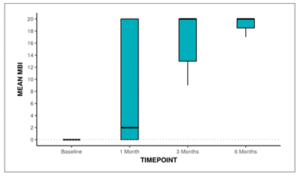
Figure 17: Box and Whisker plot showing change in MBI over Time
Post-hoc pair wise analysis was performed to explore at which time points the MBI differed significantly from the Baseline time point. The following table 19 summarizes this analysis:
Table 20: Table showing Comparison of MBI at Various Time points vs. Baseline
| Comparison of MBI at Various Time points vs. Baseline | Mean (±SD) of Difference | Range of Difference | p-value |
| 1 Month – Baseline | 6.41 (±9.08) | -16.00 – 20.00 | <0.001 |
| 3 Months – Baseline | 13.32 (±7.20) | 0.00 – 20.00 | <0.001 |
| 6 Months – Baseline | 14.81 (±6.50) | 0.00 – 20.00 | <0.001 |
The MBI differed significantly from the Baseline time point at the following time points: 1 Month, 3 Months, 6 Months. The maximum change from the Baseline time point was observed at the 6 Months timepoint. Table 20 and Figure 18 show the mean MASH-P score of patients over 6 months follow-up. The average MASH-P Score at baseline was 7.14 ± 1.96. After 1 month, the mean MASHP Score decreased to 5.30 ± 4.12. At 3 months, the mean MASH-P Score further decreased to 1.75 ± 2.80, and by 6 months, it reached 1.04 ± 2.14.
Table 21: Table showing mean MASH-P score of patients over 6 months follow-up.
| MASHP Score | Mean ± SD | Min – Max |
| Baseline | 7.14 ± 1.96 | 3.0 – 10.0 |
| 1 Month | 5.30 ± 4.12 | 0.0 – 10.0 |
| 3 Months | 1.75 ± 2.80 | 0.0 – 9.0 |
| 6 Months | 1.04 ± 2.14 | 0.0 – 9.0 |
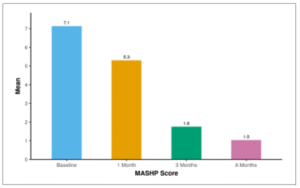
Figure 18: Figure showing mean MASH-P score of patients over 6 months follow-up.
Table 22: Table showing change in MASH-P score over 6 months
| Time point | Friedman Test | |||
| Mean (SD) | Range | χ2 | P Value | |
| Baseline | 7.14 (1.96) | 3.00 – 10.00 | 56.0 | <0.001 |
| 1 Month | 5.30 (4.12) | 0.00 – 10.00 | ||
| 3 Months | 1.75 (2.80) | 0.00 – 9.00 | ||
| 6 Months | 1.04 (2.14) | 0.00 – 9.00 | ||
Non-parametric tests (Friedman test) were used to make statistical inferences as data were not normally distributed. Friedman test was used to explore whether the MASHP Score changed significantly over time. The mean MASHP Score decreased from a maximum of 7.14 at the Baseline timepoint to a minimum of 1.04 at the 6 Months’ time point. This change was statistically significant (Friedman Test: χ2 = 56.0, p = <0.001).
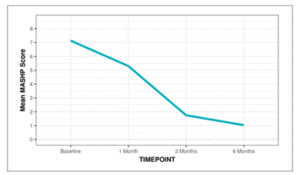
Figure 19: Line diagram depicting the change in MASHP Score over time.
The Box-and-Whisker plot below depicts the distribution of the MASHP Score over different time points. In each box, the middle horizontal line represents the median MASHP Score, the upper and lower bounds of the box represent the 75th and the 25th centile of the MASHP Score respectively, and the upper and lower extent of the whiskers represent the Tukey limits for MASHP Score at each of the timepoints respectively.
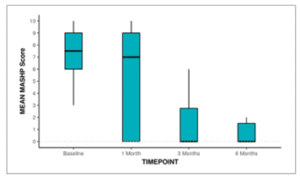
Figure 20: Box-and-Whisker plot showing the change in MASH-P over 6 months
Post-hoc pair wise analysis was performed to explore at which time points the MASHP Score differed significantly from the Baseline time point. The following table summarizes this analysis. There was no significant difference between any of the time points as compared to the Baseline time point in terms of the MASHP Score.
Table 23: Table showing change in MASH-P score over 6 months
| Comparison of MASHP Score at Various Timepoints vs Baseline | Mean (SD) of Difference | Range of Difference | p-value |
| 1 Month – Baseline | -1.74 (3.23) | -9.00 – 4.00 | 0.282 |
| 3 Months – Baseline | -4.46 (2.43) | -9.00 – 2.00 | 0.829 |
| 6 Months – Baseline | -5.15 (2.23) | -9.00 – 1.00 | 0.866 |
Table 24 shows the outcome of patients in terms of requirement of operative intervention/ICU care and mortality. 68.0% of participants did not undergo operative intervention, while 26.0% had a ventriculoperitoneal (VP) shunt. Additionally, 4.0% underwent a revision of the VP shunt, and 2.0% had endoscopic diversion or third Ventriculostomy. Concerning intensive care unit (ICU) care, 62.0% of participants did not require ICU care. Among those who did, 22.0% needed Ventilatory support due to bulbar involvement or respiratory failure, 6.0% had ICU care for Dys electrolyte mia, and 10.0% received ICU care for aspiration Pneumonitis. Regarding mortality, 54.0% of participants were alive, while 46.0% had unfortunately passed away.
Table 24: Table showing outcome of patients in terms of requirement of operative intervention/ICU care and mortality
| Outcome | n (%) |
| Operative Intervention | |
| None | 34 (68.0%) |
| VP Shunt | 13 (26.0%) |
| Revision of VP Shunt | 2 (4.0%) |
| Endoscopic Diversion/ Third Ventriculostomy | 1 (2.0%) |
| ICU Care | |
| None | 31 (62.0%) |
| Ventilatory Requirement (Bulbar Involvement, Respiratory Failure) | 11 (22.0%) |
| Dys electrolyte mia | 3 (6.0%) |
| Aspiration Pneumonitis | 5 (10.0%) |
| Mortality | |
| Alive | 27 (54.0%) |
| Death | 23 (46.0%) |
Table 25 shows various parameters found to have positive correlation with mortality on univariate analysis. Among various clinical parameters, symptoms like blurring of vision, loss of appetite, and motor deficit at presentation showed a significant correlation with mortality. The presence of papilledema, severity of TBM, and the existence of hydrocephalus, infarct, and tuberculoma on MRI were also correlated with mortality. Additionally, the need for ICU care and operative management demonstrated a significant correlation with mortality. Here are some key observations: The average age of survivors (31.33 years) is slightly lower than that of non-survivors (35.35 years), but the difference is not statistically significant (p = 0.8151). There is no significant difference in gender distribution between survivors and non-survivors (p = 0.3092). Most clinical symptoms, including fever, headache, nausea/vomiting, and altered mental status (AMS), show no significant differences between the two groups. Blurring of vision, loss of appetite (LOA), and Motor deficit at presentation are significantly more prevalent in non-survivors. Non-survivors exhibit a higher prevalence of cranial nerve palsy, particularly involving the sixth cranial nerve, and Motor deficit at presentation is significantly associated with non-survivors. GCS is significantly lower in non-survivors (9.74) compared to survivors (12.07), indicating a more severe impairment of consciousness (p = 0.0021). The presence of papilledema at baseline and 1 month is significantly higher in non-survivors (p < 0.0012). The severity of TBM at 1 month is significantly associated with mortality (p < 0.0013). CRP levels are significantly higher in non-survivors (p < 0.0011). Hydrocephalus at baseline and 1 month, as well as the presence of infarcts in the MCA territory at 1 month, are significantly associated with non-survivors. Non-survivors show a significantly lower MBI at 1 and 3 months and a higher MASHP score at baseline, 1 month, and 3 months. Non-survivors are more likely to undergo operative intervention (p = 0.0043) and require ICU care (p = 0.0193).
Table 25: Table showing correlation of various parameters with mortality on univariate analysis. (Only positive correlation are shown)
| Parameters | Mortality | p-value | |
| Alive (n = 27) | Death (n = 23) | ||
| Blurring of Vision (Present)*** | 0 (0.0%) | 5 (21.7%) | 0.0163 |
| LOA (Present)*** | 2 (7.4%) | 8 (34.8%) | 0.0303 |
| Weakness (Presentation)*** | 0.0033 | ||
| None | 23 (85.2%) | 12 (52.2%) | |
| Hemiparesis | 1 (3.7%) | 5 (21.7%) | |
| Paraparesis | 3 (11.1%) | 1 (4.3%) | |
| Quadriparesis | 0 (0.0%) | 5 (21.7%) | |
| GCS*** | 12.07 ± 2.72 | 9.74 ± 2.65 | 0.0021 |
| Cranial Nerve Palsy: None (Yes)*** | 20 (74.1%) | 10 (43.5%) | 0.0282 |
| Papillo oedema (Baseline) (Present)*** | 4 (14.8%) | 16 (69.6%) | <0.0012 |
| Papillo oedema (1 Month) (Present)*** | 3 (11.1%) | 16 (69.6%) | <0.0012 |
| Severity of TBM (1 Month) *** | <0.0013 | ||
| Grade 1 | 19 (70.4%) | 0 (0.0%) | |
| Grade 2 | 3 (11.1%) | 0 (0.0%) | |
| Grade 3 | 5 (18.5%) | 19 (100.0%) | |
| CRP (mg/L) *** | 22.82 ± 39.02 | 74.52 ± 72.06 | <0.001 |
| Hydrocephalus (Baseline)*** | 0.003 | ||
| None | 18 (66.7%) | 4 (17.4%) | |
| Mild | 5 (18.5%) | 10 (43.5%) | |
| Moderate | 3 (11.1%) | 5 (21.7%) | |
| Severe | 1 (3.7%) | 4 (17.4%) | |
| MCA Infarcts (Baseline) (Present)*** | 7 (25.9%) | 13 (56.5%) | 0.0282 |
| Hydrocephalus (1 Month) *** | <0.0013 | ||
| None | 17 (63.0%) | 5 (21.7%) | |
| Mild | 7 (25.9%) | 1 (4.3%) | |
| Moderate | 2 (7.4%) | 1 (4.3%) | |
| Severe | 1 (3.7%) | 16 (69.6%) | |
| Location of Infarct: None (1 Month) (Present)*** | 20 (74.1%) | 4 (17.4%) | <0.0012 |
| MCA Infarcts (1 Month) (Present)*** | 5 (18.5%) | 14 (60.9%) | 0.0022 |
| Exudates (3 Months) (Yes)*** | 10 (37.0%) | 1 (4.3%) | 0.0052 |
| Location of Infarct: None (3 Months) (Present)*** | 25 (92.6%) | 1 (4.3%) | <0.0012 |
| Tuberculomas (3 Months) (Present)*** | 16 (59.3%) | 1 (4.3%) | <0.0012 |
| Location of Infarct: None (6 Months) (Present)*** | 25 (92.6%) | 1 (4.3%) | <0.0012 |
| Tuberculomas (6 Months) (Present)*** | 14 (51.9%) | 0 (0.0%) | <0.0012 |
| MBI (1 Month) *** | 14.07 ± 8.15 | 0.37 ± 1.01 | <0.0011 |
| MBI (3 Months) *** | 16.62 ± 6.38 | 4.50 ± 6.36 | 0.0221 |
| MASHP Score (Baseline)*** | 6.07 ± 1.90 | 8.39 ± 1.12 | <0.0011 |
| MASHP Score (1 Month) *** | 2.67 ± 3.41 | 9.05 ± 0.62 | <0.0011 |
| MASHP Score (3 Months) *** | 1.27 ± 2.24 | 8.00 ± 1.41 | 0.0081 |
| Operative Intervention*** | 0.0043 | ||
| None | 23 (85.2%) | 11 (47.8%) | |
| VP Shunt | 3 (11.1%) | 10 (43.5%) | |
| Revision of VP Shunt | 0 (0.0%) | 2 (8.7%) | |
| Endoscopic Diversion/ Third Ventriculostomy | 1 (3.7%) | 0 (0.0%) | |
| ICU Care*** | 0.0193 | ||
| None | 20 (74.1%) | 11 (47.8%) | |
| Ventilatory Requirement (Bulbar Involvement, Respiratory Failure) | 3 (11.1%) | 8 (34.8%) | |
| Dys electrolytemia | 3 (11.1%) | 0 (0.0%) | |
| Aspiration Pneumonitis | 1 (3.7%) | 4 (17.4%) | |
DISCUSSION
Tubercular meningitis (TBM) is a severe form of CNS TB. This study aimed to identify predictive factors influencing the outcome in patients with TBM. The primary objectives included studying the correlation of clinical, cerebrospinal fluid (CSF), and imaging parameters with the outcome, while the secondary objective was to predict the outcome using the MASH-P scoring system [13].The demographic data revealed a mean age of 33.18 ± 14.05 years, with a higher prevalence in females (64.0%), F: M ratio was 1.7:1. This distribution aligns with the general understanding of TBM affecting a broad age range and being slightly more prevalent in females [18]. Out of the total patient cohort, 32 individuals (64%) were categorized with a definitive diagnosis of TB, 18 patients (36%) were identified as having highly probable TB, and none (0%) fell into the category of possible TB. This stands in contrast to studies like the one conducted by UK [15], where only 39.2% of participants received a definitive diagnosis. The higher proportion of definitive diagnoses in our study can be primarily attributed to the utilization of Gene X-pert Ultra, which demonstrates greater sensitivity compared to the previously employed TB Gene X-pert for detecting Mycobacterium Tuberculosis bacilli in cerebrospinal fluid samples [14]. At Baseline, 8.0% of participants displayed Grade 1 severity, 18.0% exhibited Grade 2, and a significant 74.0% manifested Grade 3, differing from the findings in [19], where 49.3% were in Stage I and the remainder in stages II & III. Possible explanations include our institution serving as a tertiary care center, primarily receiving complex TBM cases. Additionally, the impact of the COVID-19 pandemic may have compromised outpatient services, leading to patients neglecting early signs and symptoms of TBM. This underscores the critical importance of promptly identifying TBM at its early stages. In our study, 94.0% of patients reported fever and 84.0% experienced headaches. Nausea and vomiting were present in 68.0%, which is consistent with the results from Modi et al(20), where fever was reported in 93.3% and headaches in 95.2%. Vomiting occurred in 80.9%. Altered mental status was observed in 74.0% of our study participants, while [17] reported altered sensorium in 48.3% of patients, potentially linked to a higher prevalence of Grade 3 TBM cases in our study. Seizures were documented in 20.0% of our patients, aligning with the study by [20], which reported seizures in 23.4%. In our study, neck rigidity was present in 72.0%, Kernig’s sign was positive in 60.0%, and ataxia was evident in 11%. At the time of presentation, focal deficit was observed in 30.0%, and sensory loss in 10%. These findings closely resemble the comparison study by [16], where neck rigidity was reported in 68.4%, Kernig’s sign was positive in 66.5%, and the focal deficit was noted in 32.1%. Ataxia was observed in 7.2%, and sensory loss was reported in 6.2%. Cranial Nerve Palsy was noted in 40% of the patients with sixth cranial nerve palsy being the most frequent (30%). Papilledema was present in 40% of the patients which is the same as the study by (40.6%) [16]. In our study, 92.0% of participants initially exhibited exudates at baseline, and 66% presented with hydrocephalus. Additionally, 10.0% showed the presence of an infarct in the anterior cerebral artery (ACA) territory, 40.0% in the middle cerebral artery (MCA) territory, and 8.0% in the posterior cerebral artery (PCA) territory. Moreover, half of the participants (50.0%) displayed the presence of tuberculoma at the baseline assessment. This heightened prevalence of hydrocephalus, infarcts, tuberculomas, and exudates at baseline in our study suggests a greater severity of TBM in participants compared to the study by [18], which reported hydrocephalus in 52.1%, exudates in 82.3%, infarcts in 23.9%, and tuberculomas in 45.6%. Furthermore, Rizvi et al found tuberculomas in 29.4%, infarcts in 11.8%, and hydrocephalus in 51.3% [2]. We performed a comprehensive analysis, including total count, differential count, protein, sugar, and GeneXpert Ultra assessments for all participants in our study. Nevertheless, there was no correlation observed between any of the cerebrospinal fluid (CSF) findings and mortality outcomes. This aligns with the findings of Modi et al., whose study similarly reported no correlation between CSF findings and mortality [20]. During the course of the study, a total of 23 patients, constituting 46% of the participants, succumbed to the condition. The observed mortality rate is notably higher when compared to the findings of [2], who reported a mortality rate of 17.48%, and [17], who documented a mortality rate of 25.4%. The primary reason for this discrepancy can be attributed to the fact that [2] study cohort had only 26.4% in stage 3 TBM, and [16] study cohort had 39.8% in stage 3 TBM, whereas our study group comprised a significant 74% in stage 3 TBM. This raises concerns about the substantial delays in the diagnosis and referral process to tertiary centers, such as ours. Our study identified several clinical and radiological parameters that demonstrated associations with mortality and the MASH-P scoring system proved effective in predicting mortality over six months on univariate analysis. This underscores the advantageous role of this scoring system as a bedside prognostic tool for patients with tuberculous meningitis (TBM), aiding in informing the prognosis to patients’ relatives and intensifying therapy for those at high risk. However, on multivariate analysis of the parameters, none were found to have statistically significant correlation with mortality. The study highlighted the critical importance of early identification and referral of patients, given that many were admitted in advanced stages of TBM. Additionally, the consideration of substituting CT scans for MRI, as implemented in our study, warrants attention, particularly in resource-limited settings where MRI availability is a challenge, provided that the reproducibility of results is carefully evaluated.
- CONCLUSIONS
Tubercular Meningitis (TBM) is a common Central Nervous System (CNS) infection in India and is a serious public health issue that results in significant morbidity and mortality. As per the Index TB Guidelines, TBM constitutes 1% of all cases of TB and has been associated with a poor neurological outcome. This study focused on the various outcome predictors as well as the credibility of the MASH-P scoring system in the prediction of 6-month mortality and possible outcomes in patients with tubercular meningitis. Early prognostication can be beneficial in changing the course of the disease itself. A prospective observational study was done for a period of one and a half years. All medical units of the Post Graduate Institute of Medical Education and Research, Chandigarh are included. All tubercular meningitis patients admitted in medical wards and sub-specialties (Emergency, Internal Medicine, Intensive care) as per the Lancet consensus criteria will be enrolled in the present study after obtaining informed consent. A total of 50 individuals were included in our study. The average age in our group was 33.18 ± 14.05 years, and the gender ratio was 1.7:1 (F:M). The majority (74%) of patients were classified under stage 3 Tuberculous Meningitis (TBM). The mortality rate within the study cohort was 46%, predominantly observed among those with stage 3 TBM. The majority (74%) of patients were classified under stage 3 Tuberculous Meningitis (TBM). The mortality rate within the study cohort was 46%, predominantly observed among those with stage 3 TBM. Regarding clinical parameters, symptoms such as blurred vision, loss of appetite, and motor deficit at the initial presentation exhibited a noteworthy correlation with mortality. Additionally, the presence of papilledema, TBM severity, and the occurrence of hydrocephalus, infarct, and tuberculoma on MRI were linked to mortality. Moreover, MASH-P scores demonstrated a correlation with mortality. These associations were determined on univariate analysis. However, in the multivariate regression analysis, none of the parameters demonstrated statistical significance.
REFERENCES
- Tuberculous meningitis: A narrative review [Internet]. Available from: https://www.jcrsmed.org/article.asp?issn=2455-3069;year=2019;volume=5;issue=1;spage=13;epage=22;aulast=Vinny
- Rizvi I, Malhotra HS, Garg RK, Kumar N. Derivation of a bedside score (MASH-P) to predict 6-month mortality in tuberculous meningitis. J Neurol Sci. 2020 Aug;415:116877.
- TB Statistics India [Internet]. TBFacts. [cited 2022 Jun 26]. Available from: https://tbfacts.org/tb-statistics-india/
- Davis AG, Rohlwink UK, Proust A, Figaji AA, Wilkinson RJ. The pathogenesis of tuberculous meningitis. J Leukoc Biol. 2019 Feb;105(2):267–80.
- Schaller MA, Wicke F, Foerch C, Weidauer S. Central Nervous System Tuberculosis: Etiology, Clinical Manifestations and Neuroradiological Features. Clin Neuroradiol. 2019 Mar;29(1):3–18.
- Ahuja GK, Mohan KK, Prasad K, Behari M. Diagnostic criteria for tuberculous meningitis and their validation. Tuber Lung Dis. 1994 Apr;75(2):149–52.
- Marais S, Thwaites G, Schoeman JF, Török ME, Misra UK, Prasad K, et al. Tuberculous meningitis: a uniform case definition for use in clinical research. Lancet Infect Dis. 2010 Nov;10(11):803–12.
- Sazzad Hossain, Dr. Deb Dulal & Dr. Fuad Faysal (2024). Prevalence of Cardiovascular Disease and Associated Risk Factors among Adults. Dinkum Journal of Medical Innovations, 3(05):379-390.
- Thao LTP, Heemskerk AD, Geskus RB, Mai NTH, Ha DTM, Chau TTH, et al. Prognostic Models for 9-Month Mortality in Tuberculous Meningitis. Clin Infect Dis. 2018 Feb 1;66(4):523–32.
- STREPTOMYCIN TREATMENT OF TUBERCULOUS MENINGITIS. The Lancet [Internet]. 1948 Apr [cited 2022 Jun 26];251(6503). Available from: https://linkinghub.elsevier.com/retrieve/pii/S0140673648920030
- Collin C, Wade DT, Davies S, Horne V. The Barthel ADL Index: A reliability study. Int Disabil Stud. 1988 Jan;10(2):61–3.
- MDApp [Internet]. [cited 2022 Jun 26]. Modified Barthel Index for Activities of Daily Living Calculator. Available from: https://www.mdapp.co/modified-barthel-index-for-activities-of-daily-living-calculator-362/
- Jha SK, Garg RK, Jain A, Malhotra HS, Verma R, Sharma PK. Definite (microbiologically confirmed) tuberculous meningitis: predictors and prognostic impact. Infection. 2015 Dec;43(6):639–45.
- Hsu PC, Yang CC, Ye JJ, Huang PY, Chiang PC, Lee MH. Prognostic Factors of Tuberculous Meningitis in Adults: A 6-Year Retrospective Study at a Tertiary Hospital in Northern Taiwan. J Microbiol Immunol Infect. 2010 Apr;43(2):111–8.
- Misra UK, Kalita J, Srivastava M, Mandal SK. Prognosis of tuberculous meningitis: a multivariate analysis. J Neurol Sci. 1996 Apr;137(1):57–61.
- Thwaites GE, Bang ND, Dung NH, Quy HT, Oanh DTT, Thoa NTC, et al. Dexamethasone for the Treatment of Tuberculous Meningitis in Adolescents and Adults. N Engl J Med. 2004 Oct 21;351(17):1741–51.
- Verma R, Sarkar S, Garg RK, Malhotra HS, Sharma PK, Saxena S. Ophthalmological manifestation in patients of tuberculous meningitis. QJM Int J Med. 2019 Jun 1;112(6):409–19.
- Thwaites GE, Van Toorn R, Schoeman J. Tuberculous meningitis: more questions, still too few answers. Lancet Neurol. 2013 Oct;12(10):999–1010.
- Song X, Wen L, Li M, Yu X, Wang L, Li K. New-onset seizures in adults with tuberculous meningitis during long-term follow-up: Characteristics, functional outcomes and risk factors. Int J Infect Dis. 2020 Apr;93:258–63.
- Modi M, Sharma K, Prabhakar S, Goyal MK, Takkar A, Sharma N, et al. Clinical and radiological predictors of outcome in tubercular meningitis: A prospective study of 209 patients. Clin Neurol Neurosurg. 2017 Oct;161:29–34.
Publication History
Submitted: March 09, 2025
Accepted: March 28, 2025
Published: March 31, 2025
Identification
D-0414
DOI
https://doi.org/10.71017/djmi.4.3.d-0414
Citation
Sagun Baral (2025). Evaluation of Predictors of Outcome in Patients with Tubercular Meningitis. Dinkum Journal of Medical Innovations, 4(03):81-103.
Copyright
© 2025 The Author(s).