

")
Publication History
Submitted: April 05, 2025
Accepted: April 20, 2025
Published: May 31, 2025
Identification
D-0426
DOI
https://doi.org/10.71017/djmi.4.5.d-0426
Citation
Ruby Manandhar & Raj Kumar Sangroula (2025). Factors Associated with Nutritional Status among Adolescents of Kathmandu Metropolitan City: A Comparative Study Between Public and Private Schools. Dinkum Journal of Medical Innovations, 4(05):273-297.
Copyright
© 2025 The Author(s).
273-297
Factors Associated with Nutritional Status among Adolescents of Kathmandu Metropolitan City: A Comparative Study Between Public and Private SchoolsOriginal Article
Ruby Manandhar *1, Raj Kumar Sangroula 2
- Lecturer, CAFODAT College, Kumaripati, Lalitpur, Nepal.
- Asst. Professor, New Era, Kalopul, Lalitpur, Nepal.
* Correspondence: manandhar.ruby@gmail.com
Abstract: Adolescence is a vital stage of development, marked by negotiating difficult social situations and consolidating identity as adolescents’ journey into emerging adulthood. Overweight and obesity are major risk factors for several chronic diseases, including diabetes, cardiovascular diseases, and cancer. Overweight/obesity are major risk factors for several chronic diseases, including diabetes, CVDs and cancer. This study assessed the prevalence and factors associated with Nutritional status among the adolescents of private and public schools of Kathmandu Metropolitan City. An analytical cross-sectional study was carried out among N=293 adolescents from 6 public (158) and 6 private (135) schools. A simple random sampling was used for selection of schools and students which was chosen from each 32-ward based upon direction. Anthropometric measurement was used to determine nutritional status and household measurements was used for 24-hour dietary recall. SPSS was applied to analyze the structured questionnaire data using the chi-square test, binary and multiple logistic regressions. Written and verbal consent were taken from both the parents and students. The study, 2.4% were found severely thin, 14.7% thin, 61.1% normal, 17.1% overweight and 4.8% obese. Prevalence of overweight/obesity was higher in private schools than public schools. Private school adolescents were statistically significant with overweight/obese (p=0.008) than public school adolescents. Dietary factors like intake of nuts and fast food were significantly associated with overweight/obesity. In Multiple regressions, adolescents who had intake of eggs, adequate protein and adequate calorie intake were more likely to be overweight/obesity. Higher prevalence of overweight/obesity in private schools are due to factors like intake of fast food and high calories. Nutrition program should be focused on the healthy dietary pattern and physical activity to reduce overweight/obesity.
Keywords: nutritional status, adolescent, overweight, obesity, BMI, dietary pattern, physical activity, screen time.
- INTRODUCTION
Nutrition is a fundamental pillar of human life, health and development across the entire life span [1]. Good health and adequate nutrition promote both physical and cognitive growth. If adequate nutrition is not given it leads to malnutrition, a combination of under and over nutrition. Undernutrition is a serious chronic problem in Nepal, as in other countries of South Asia. Undernutrition in infants, adolescent girls and pregnant and lactating mothers is a major threat to their health [2]. Undernutrition continues to be a primary cause of ill health and mortality among children in developing countries. It is a major public health problem and accounts for about half of all child deaths worldwide. In developing countries, there are about 150 million undernourished children and more than half of them live in the South East Asia Region [3]. The high levels of undernutrition in children in South Asia pose a major challenge for child survival and development. Malnutrition, in every form, presents a significant threat to human health. Today the world faces the double burden of malnutrition that includes both undernutrition and overweight, especially in developing countries [4]. An adolescent is defined as a person between 10-19 years of age (WHO). There are about 1.2 billion adolescents worldwide; 85% live in developing countries [1] Adolescence is known to be a “second opportunity” for growth as it facilitates catch up growth for children experiencing nutritional deficits in their early life [5]. Adolescents are the future generation of any country and their nutritional needs are critical for the well-being of the society. The period between conception and two years of postnatal life is considered the golden 1000 days with a deep impact on a child’s ability to grow, learn, and thrive. Children are ten times more likely to overcome life-threatening childhood diseases if they get the right nutrition in their first 1,000 days. They also earn 21% more in wages as adults, complete nearly five more grades in school and are more likely to have healthier families of their own [6]. Among young adolescent mothers, the risk of having a low-birth-weight infant is high due to babies suffering from intra-uterine growth retardation [7]. Adolescent mothers bear a double burden: one involving the intra-uterine growth and development of their offspring and another involving their own growth and development. Adolescence is a vital stage of development, marked by negotiating difficult social situations and consolidating identity as adolescents’ journey into emerging adulthood [4]. Overweight and obesity are major risk factors for several chronic diseases, including diabetes, cardiovascular diseases, and cancer. According to WHO, more overweight children is in developing countries with a higher rate of increment as compared to the developed world. Estimates from 2016 [8] shows that between 11 million to 124 million school-aged children and adolescents worldwide are obese, a more than 10-fold rise in just 40 years. According to NDHS 2022 5% of the adolescents aged 15-19 years are overweight. While, 39% of adults worldwide were overweight and obese (BMI 25 kg/m²) and 13% of individuals were obese (BMI 30 kg/m²) in 2016. According to Global school health survey (GSHS) 2015, 10.9% adolescents’ students were underweighted, 6.7% overweight and 0.6% obese respectively. In Asian countries, prevalence of adolescent obesity and overweight was 8.6% & 14.6% [9]. LMICS account for 77% of all NCD-related fatalities globally. NCDs risk factor collaboration noted a faster rise in BMI in Southeast Asian and South Asian nations, including Nepal [10]. Obesity has a major impact on the human capital index (HCI), which is a key factor in developing human capital and a core driver of sustainable growth and poverty reduction. Optimal nutrition can only be achieved if the world’s poor have access to the information, materials, and services required [11]. Obesity and undernutrition are coexisting in Nepal as it transitions. However, there is a lack of accurate information on childhood and adolescent obesity or overweight in Nepal. Previous studies in Nepal have mainly focused on socio demographic factors related to childhood obesity and none reported diet and physical activity-related risk factors and its association. A few studies have linked increased intake of sweet and salty snacks, as well as decreased consumption of fruits and vegetables, to increased obesity in teenagers [12]. Adult overweight and obesity are more common, up from 4% in 2000 to 6% in 2016 [13]. Prevalence of overweight/obesity among adolescents in underdeveloped and developing countries are rising at a higher rate compared to developed nations. Adolescents spend more time away from their families than younger children do, so they are exposed to a wider variety of meals than they may be used to at home. Adolescents are more likely to acquire obesogenic habits as their levels of independence rise, which raises the risk of obesity. However, the factors associated with overweight and obesity are not well understood in Nepal. Although there have been fewer studies the prevalence of overweight among adolescents in Nepal has been reported to be 12.2%, 8.1%, and 1% [14] still the factors associated with these studies have not been thoroughly investigated. Moreover, only few studies have been conducted in public and private schools of Kathmandu valley. Thus, the study assessed the factors associated with adolescent nutritional status among in private and public schools of KMC and significant differences in the nutritional status of adolescents attending public versus private schools of KMC, highlighting potential disparities in diet, nutrition and health. By comparing public and private school students, the study can provide insights into how socioeconomic status influences nutritional habits and health outcomes. The study filled the gap in the existing literature on the comparative analysis of nutritional status between public and private school students. Findings can pave the way for future research on interventions and policies aimed at reducing nutritional disparities among adolescents. Overall, this study has the potential to make significant contributions to future researchers to conduct interventional studies in the nutritional status among adolescents in different school settings.
- MATERIALS & METHOD
An analytical cross-sectional study was conducted among adolescents of private and public-school students Kathmandu Metropolitan City. The study duration was 6 months period. The study was conducted in private and public schools of Kathmandu Metropolitan City of Bagmati province of Nepal. The target population was all the adolescent students (10-19) years of grade 8 and 9 of public and private schools. Adolescent students of 8 and 9 students of public and private schools. Disabled adolescent students and seriously ill students were excluded from the study. The required sample size for the research was found to be 286 which was calculated by taking 9.3% of prevalence in previous studies conducted in Makwanpur, Nepal [15].
Using the formulae of single proportionate formula:
n=z²pq/e ²
Where,
n=is the desired sample size
z=is the critical value at 95% confidence level (1.96)
P= prevalence
q=1-p
= 1- 0.093
e= is the margin of error at 5% which is 0.05
Now,
n=z²pq/e ² = (1.96) ² x 0.093 x (1-0.093)/ (0.05) ²
= 130 x 2 (where 2 is the desired effect) = 260
Sample size= 260
Adding 10% non-response rate sample size was= 286.
Total of 355 students were sampled for data collection. While after generating from random number table from SPSS the sample was 293.There are 504 private schools 89 public schools in Kathmandu Metropolitan City. Simple random sampling was used for the selection of school. All students of class 8 and 9 who were willing to participate except ill and disabled students were selected for the data collection. The study collected sample of 293 adolescent students of private and public schools of KMC. The respondents were adolescents of class 8 and 9 students. The data collection was done by using simple random sampling for the selection of the schools. The concerned authorities of KMC provided the most recent list of secondary schools of public schools and private schools list was obtained from PABSON and N-PABSON organization of schools. There are 32 wards in KMC. Each ward was categorized according to the direction (north, east, west, south and core). 1 public and 1 private school were chosen from each ward by using simple random sampling. Students presented at the time of data collection who was willing to participate was sampled. While during analysis all the student’s data was entered and selected with the software generated random numbers in SPSS. Data collection tools that were applied by using validated structured questionnaire from adolescent nutrition survey 2014 for assessing adolescents’ sociodemographic characteristics and anthropometric measurement. Global school-based student health survey (GSHS) 2021 was used for the physical activity. Height and weight were measured using stadiometer and seca digital weighing machine respectively. The participants were instructed to stand with their heels together, heads looking straight ahead, arms to the side, legs straight, and shoulders relaxed. The researcher made sure the back of the head, scapulae, heels, and buttocks were all in contact with the stadiometer’s vertical surface. At eye level, the measurement was taken. Weight was measured using an electronic digital weighing scale seca in accordance with WHO standard protocol. The scale was read to zero before each measurement. The participants took the measure without shoes, wearing only the barest minimum of clothing and removing bulky outerwear like jackets, hooded sweatshirts, thick belts, etc. Physical activity was also assessed by using the guidelines of GSHS 2021. Tools such as 24-hour dietary recall questionnaire was used to access the food intake. Structured questionnaire was used to captured the frequency and variety of foods consumed over a specified period. Dietary pattern was adopted from minimum dietary guidelines of FAO. Using a 24-hour recall dietary form, the type and amount of food consumed over the previous 24 hours was evaluated. How much they had consumed the day before or over the course of the previous 24-hour was a question posed to the respondents. Throughout the interview, respondents were asked to recall everything they had eaten in the previous day, both inside and outside of their homes. To measure the amount of food consumed in millimeters or grams, common household items like spoons, glasses, bowls, and plates were used. The principal investigator approached 24-hour recall diet questions. Every adolescent who participated in the dietary assessment had a face-to-face interview to collect data for the 24-hour dietary recall. Throughout the investigation, six standard bowls, one plate, one glass, and three spoons in different sizes were used. Cooked rice was standardized and labeled as either half or full plate. Depending on the food item, measurements of foods and beverages were taken using either standardized cooked food, measuring instruments, or a photographic food atlas of India that served as a pictorial size guide. The total energy, macronutrients (carbohydrate, fats, protein) and fast food were entered in MS-excel and the entered data was imported in SPSS. Adolescents’ food intake was quantified for nutrients using Nutri-survey application and the food composition table (FCT) of Nepal. The obtained data on estimated intake of carbohydrate, fats, proteins and energy were compared to RDA of ICMR, NIN, 2020, separately for boys and girls. FFQs was administered to assess the habitual dietary intake of the specified period (e.g. weekly, monthly). The accuracy and consistency of the data was examined after it has been collected. Data was be edited, coded, and categorized and analysis was performed on it. After processing the data, IBM SPSS statistics version 26 was entered and analyzed it. Descriptive statistics (frequency, percentage, mean and standard deviation) and non- parametric test, chi- square test was used to examine the relationship between variables. Additionally, using SPSS, the WHO’s BMI-for-age z-score (BAZ) was computed and categorized in accordance with the guidelines for the age group of 5-19 years. A wall-mounted clinical stadiometer was used to measure the subjects’ height in centimeters. Weight was measured with a portable digital weighing machine and recorded in kilograms (kg). Additionally, the BMI Z-score-a measure of body mass index for age was computed and categorized into five categories: normal (+1 to -1 SD), obese (> +2 SD), overweight (> +1 SD), thin (< -2 SD), and severely thin (< -3 SD). Further, to express the magnitude in relation to the reference category in the odds (OR >1.00 or OR & lt; 1.00) of the variables of interest, unadjusted and adjusted odds ratios (OR) were presented in the results. The cutoff point for the significance level of the results was set at a p-value < 0.05 and a 95% confidence interval (CI). For quantifying the amount of food in 24-hour recall diet food model was used. 24-hour recall diet analysis was done using food composition table (FCT) of Nepal, food model and food atlas of India for consumption of cereals and grains, vegetables, fruits, meat, fish, egg, processed food. The consumed food was calculated on the basis of standardization of food according to the food composition table of Nepal.
- RESULTS & DISCUSSION
Socio-demographic data of public and private school adolescents like age, sex, grade, family type, ethnicity, mother’s education, father’s education and family income were considered for descriptive analysis with nutritional status among adolescents. More than half of the respondents (158) were from public schools. Mean and SD age of the study participants was 15.20± 0.98 in public schools and 14.42 ± 1.06 in private schools. Almost (87.4%) students belonged to the age group of 13-15 years in private schools while only 62% of them in public schools. Among the total 293 respondents, compared to adolescents attending private schools, just 41.5% of them engage in physical activity for at least 60 minutes per day, whereas over half (55%) of adolescents attending public schools were active for the full seven days. Although teenagers were physically active for one to three days 44.9% of public schools and 58.5% of private schools engaged in it. Near to one third (27.2%) of the students of public schools did physical exercise for all 7 days than private school adolescent 22.2%. Only 37.3% of respondents in public schools do walking or cycling for 30 minutes to one hour, compared to 49.6% of respondents in private schools. Physical education was unavailable in the majority (84.2%) of public schools but it is available in 71.9% of private schools. Almost all (100%) of private schools and near to three quarter (72.2%) of public schools offered a sports day program while 27.8% public schools didn’t offer it. While majority (86.1%) of teenagers in public schools helped their parents with household tasks, and 42.1% of teenagers in private schools always assist their parents with household chores. Likewise, less than one third (26.7%) of private school adolescents and 13.9% of public-school adolescents often assist their parents in the household chores. About 5.9% of teenagers attending private schools reported smoking for less than 30 days, compared to 3.8% of teenagers attending public schools. Teenagers attending both public and private schools reported smoking an average of 1.07 ± 0.26 days per month. Adolescents attending private schools 26.7% consumed more alcohol beer/wine than those attending public schools 7.6%. Around 11% of adolescents in both schools were exposed to screen for > 4 hours each day. While, more than two third (69.6%) of private school adolescents used the electronic gadgets for 2-4 hours per day. Majority (88%) of the respondents in public schools often used digital devices while eating their food followed by more than three fourth (78.5%) in private schools. While 21.5% in private and 12% in public schools’ adolescents always used digital devices while eating their food. Among total study participants, almost all (100%) in both public and private schools had the daily intake of cereals/pulses. About 10.8% of the respondents in public schools and only 7.4% in private school’s students were vegetarian. Majority (92.6%) of them in private and 89% in private schools’ adolescents were non vegetarian. Whereas 16% of participants in private schools and 12.1% in public schools consumed meat every day.
Table 01: Socio-demographic characteristics, Life-style and Dietary pattern of public and private schools
| Socio-demographic characteristics | Public schools (n=158)
N (%) |
Private schools (n=135)
N (%) |
| Age in years
13-15 16-18 Mean ± SD |
98 (62%) 60 (38%) 15.20 ± 0.98 |
118 (87.4%) 17 (12.6%) 14.42 ± 1.06 |
| Sex
Male Female |
84 (53.2%) 74 (46.8%) |
76 (56.3%) 59 (43.7%) |
| Ethnicity
Brahmin/ Chhetri Dalit Jana Jati Madhesi/Muslim |
12 (7.6%) 53 (33.5%) 27 (17.1%) 66 (41.8%) |
42 (31.1%) 6 (4.4%) 61 (45.2%) 26 (19.3%) |
| Family type
Nuclear Joint/extended |
102 (64.6%) 56 (35.4%) |
79 (58.5%) 56 (41.5%) |
| Grade
8 9 |
61 (38.6%) 97 (61.4%) |
69 (51.1%) 66 (48.9%) |
| Mother’s education
Illiterate Primary level Secondary level More than secondary/ higher secondary |
72 (45.6%) 30 (19%) 26 (16.5%) 30 (19%) |
15 (11.1%) 29 (21.5%) 43 (31.9%) 48 (35.6%) |
| Father’s education
Illiterate Primary level Secondary level More than secondary/higher secondary |
67 (42.4%) 31 (19.6%) 24 (15.2%) 36 (22.8%) |
10 (7.4%) 19 (14.1%) 43 (31.9%) 63 (46.7%) |
| Family monthly income (Rs)
10000-50000 50001- 150000 |
128 (81%) 30 (19%) |
24 (17.8%) 111 (82.2%) |
| Life style characteristics | ||
| Physically active for at least 60 minutes | ||
| 1-3 days
All 7 days Mean ± SD= 1.48 ± 0.50 |
71 (44.9%)
87 (55.1%) |
79 (58.5%)
56 (41.5%) |
| Physical exercise (strengthen muscle) | ||
| 1-5 days
All 7 days Mean ± SD = 2.26 ± 0.44 |
115 (72.8%)
43 (27.2%)
|
105 (77.8%)
30 (22.2%) |
| Time spending walking or bicycling | ||
| < 30 minutes
30-60 minutes 60-120 minutes |
60 (38%)
59 (37.3%) 39 (24.7%) |
44 (32.6%)
67 (49.6%) 24 (17.8%) |
| Class of physical education
Yes No |
25 (15.8%) 133 (84.2%) |
97 (71.9%) 38 (28.1%) |
| Physical education class
Once a week Twice a week |
20 (80%) 5 (20%) |
64 (66%) 33 (34%) |
| Playing sports
Once a week Twice a week All 7 days |
N=114
21 (18.4%) 79 (69.3%) 14 (12.3%) |
N=135
35 (25.9%) 65 (48.1%) 35 (25.9%) |
| Helping parents in household activities
Always Sometimes |
136 (86.1%) 22 (13.9%) |
99 (42.1%) 36 (26.7%) |
| Habit of smoking
Yes No |
6 (3.8%) 152 (96.2%) |
8 (5.9%) 127 (94.1%) |
| Consumption of alcohol, beer and wine (n=48) | ||
| Yes
No |
12 (7.6%)
146 (92.4%) |
36 (26.7%)
99 (73.3%) |
| Exposure to screen time
< 1 hour 2-4 hours >4 hours Mean ± SD = 2.18 ± 0.91 |
42 (26.6%) 98 (62%) 18 (11.4%) |
26 (19.3%) 94 (69.6%) 15 (11.1%) |
| Eating food using digital devices Often | ||
| Always
Mean ± SD = 2.15 ± 0.96 |
139 (88%)
19 (12%) |
106 (78.5%)
29 (21.5%) |
| Dietary Pattern | ||
| Pulses
Daily Alternative |
133 (84.2%) 25 (15.8%) |
84 (62.2%) 51 (37.8%) |
| Vegetarian/ non-vegetarian (n= 266) | ||
| Vegetarian
Non-Vegetarian |
17 (10.8%)
141 (89.2%) |
10 (7.4%)
125 (92.6%) |
| Frequency of eating meat (n=266) | ||
| Daily
Alternative Twice a week |
17 (12.1%)
10 (7.1%) 114 (80.9%) |
20 (16%)
22 (17.6%) 83 (66.4%) |
| Frequency of eating eggs (n=276) | ||
| Daily
Alternative Once a week Twice a week |
25 (16.9%)
30 (20.3%) 50 (33.8%) 43 (29.1%) |
35 (27.3%)
47 (36.7%) 29 (22.7%) 17 (13.3%) |
| Frequency of intake of fish (n=276) | ||
| Once a week
Twice a month |
36 (24.3%)
112 (75.7%) |
26 (20.3%)
102 (79.7%) |
| Frequency of drinking milk and intake of milk product (n=293) | ||
| Daily
Alternative |
118 (74.7%)
40 (25.3%) |
117 (86.7%)
18 (13.3%) |
| Intake of seasonal vegetables in a week | ||
| < 5 days
> 5 days Mean ± SD = 4.6 ± 1.72 |
107 (67.7%)
51 (32.3%) |
93 (68.9%)
42 (31.1%) |
| Consumption of vitamin A rich vegetables and fruits | ||
| Always
3 times per week Mean ± SD = 2.6± 0.72 |
41 (25.9%)
117 (74.1%) |
86 (63.7%)
49 (36.3%) |
| Intake of another fruits/week
< 3 days > 3 days Mean ± SD= 2.11±0.89 |
118 (74.7%) 40 (25.3%) |
76 (56.3%) 59 (43.7%) |
| Frequency of intake of nuts (n=293) | ||
| Daily
Sometimes |
14 (8.9%)
144 (91.1%) |
31 (23%)
104 (77%) |
| Consumption of processed /fast food | ||
| Daily
Sometimes |
137 (86.7%)
21 (13.3%) |
81 (60%)
54 (40%) |
| Drinking carbonated soft drinks in past 7 days | ||
| 1-3 times
4-6 times Mean ± SD =1.79 ± 0.51 |
148 (93.2%)
10 (6.3%) |
130 (96.8%)
5 (3.7%) |
| Frequency of eating food at restaurant | ||
| Alternative
Sometimes Never |
35 (22.2%)
78 (49.4%) 45 (28.5%) |
15 (11.1%)
108 (80%) 12 (8.9%) |
| Frequency of having food from outside at home | ||
| Alternative
Sometimes Never |
26 (16.5%)
74 (46.8%) 58 (36.7%) |
21 (15.6%)
93 (68.9%) 21 (15.6%) |
| Frequency of drinking water | ||
| 1-4 glasses
5-6 glasses Mean ± SD = 2.38 ± 0.96 |
98 (62%)
60 (38%) |
71 (52.6%)
64 (47.4%) |
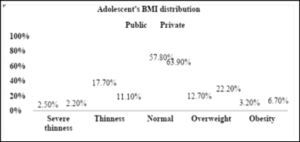
Figure 01: Adolescent’s BMI distribution of public and private schools (n=293)
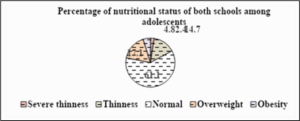
Figure 02: Nutritional status of both schools among adolescents
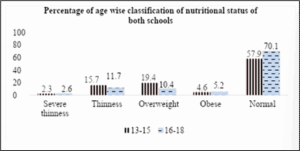
Figure 03: Age-wise classification of nutritional status among adolescents
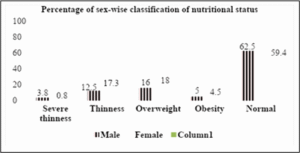
Figure 04: Sex-wise classification of nutritional status among adolescents
Table 02: Mean and SD of 24-hour dietary recall
| Macro-nutrients (gram) | Public schools | Private schools |
| Mean ± SD | Mean ± SD | |
| Protein | 65.63 ± 34.30 | 72.25 ± 30.77 |
| Fats | 48.66 ± 28.69 | 64.05 ± 34.02 |
| Carbohydrate | 267 ± 79.79 | 287.53 ± 88.01 |
| Total energy | 1770.64 ± 619.20 | 2015.69 ± 664.85 |
Table 03: Age-wise distribution of macro-nutrients according to 24-hour dietary recall
| Variables | Age of the respondents | Mean ± SD |
| Protein | 13-15
16-18 |
71.49 ± 33.51
60.86 ± 29.41 |
| Fats | 13-15
16-18 |
57.96 ± 32.93
49.97 ± 29.12 |
| Carbohydrate | 13-15
16-18 |
282.18 ± 82.78
262.97 ± 87.16 |
| Total energy | 13-15
16-18 |
1936.39 ± 641.14
1745.10 ± 662.48 |
| Processed/fast food | 13-15
16-18 |
575.80 ± 474.54
552.86 ± 484.03 |
Table 04: 24-hour dietary recall among adolescents of public and private schools
| Variables | Public schools
N (%) |
Private schools
N (%) |
| Protein
Adequate Inadequate |
98 (62%) 60 (38%) |
115 (85.2%) 20 (14.8%) |
| Fats
Adequate Inadequate |
92 (58.2%) 66 (41.8%) |
105 (77.8%) 30 (22.2%) |
| Carbohydrate
Adequate Inadequate |
149 (94.3%) 9 (5.7%) |
135 (100%) – |
| Total energy
Adequate Inadequate |
22 (13.9%) 136 (86.1%) |
31 (23%) 104 (77%) |
| Processed/fast food
Yes No Mean ± SD |
144 (91.1%) 13 (8.9%) 467.06 ± 407.65 |
132 (97.8%) 3 (2.2%) 688.34 ± 521.81 |
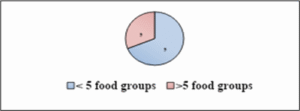
Figure 05: Minimum dietary diversity of public and private school
Table 05: Socio-demographic characteristics of public schools
| Socio-demographic characteristics | Public schools | p-value | |
| Underweight/normal | Overweight/obese | ||
| N (%) | N (%) | ||
| Age | |||
| 13-15 | 80 (81.6%) | 18 (18.4%) | 0.263 |
| 16-18 | 53 (88.3%) | 7 (11.7%) | |
| Sex | |||
| Male | 73 (86.9%) | 11 (13.1%) | 0.317 |
| Female | 60 (81.1%) | 14 (18.9%) | |
| Grade | |||
| 8 | 47 (77%) | 14 (23%) | 0.052 |
| 9 | 86 (88.7%) | 11 (11.3%) | |
| Ethnicity | |||
| Brahmin/Chhetri | 12 (100%) | – | 0.352 |
| Dalit | 42 (79.2%) | 11 (20.8%) | |
| Jana Jati | 23 (85.2%) | 4 (14.8%) | |
| Madhesi/Muslim | 56 (84.8%) | 10 (15.2%) | |
| Family type | |||
| Nuclear/single | 88 (86.3%) | 14 (13.7%) | 0.330 |
| Extended/joint | 45 (80.4%) | 11 (19.6%) | |
| Father’s education | |||
| Illiterate | 60 (89.6%) | 7 (10.4%) | 0.466 |
| Primary level | 25 (80.6%) | 6 (19.4%) | |
| Secondary level | 19 (79.2%) | 5 (20.8%) | |
| More than sec/higher sec | 29 (80.6%) | 7 (19.4%) | |
| Mother’s education | |||
| Illiterate | 64 (88.9%) | 8 (11.1%) | 0.438 |
| Primary level | 23 (76.7%) | 7 (23.3%) | |
| Secondary level | 21 (80.8%) | 5 (19.2%) | |
| More than sec/higher sec | 25 (83.3%) | 5 (16.7%) | |
| Family monthly income (Rs) | |||
| 10000-50000 | 111 (86.7%) | 17 (13.3%) | 0.071 |
| 50001-150000 | 22 (73.3%) | 8 (26.7%) | |
Table 06: Socio-demographic characteristics of private schools
| Variables | Private schools | p-value | |
| Underweight/normal | Overweight/obese | ||
| N (%) | N (%) | ||
| Age | |||
| 13-15 | 84 (71.2%) | 34 (28.8%) | 0.959 |
| 16-18 | 12 (70.6%) | 5 (29.4%) | |
| Sex | |||
| Male | 53 (69.7%) | 23 (30.3%) | 0.689 |
| Female | 43 (72.9%) | 16 (27.1%) | |
| Grade | |||
| 8 | 52 (75.4%) | 17 (24.6%) | 0.265 |
| 9 | 44 (66.7%) | 22 (33.3%) | |
| Ethnicity | |||
| Brahmin/chhetri | 33 (78.6%) | 9 (21.4%) | 0.369 |
| Dalit | 4 (66.7%) | 2 (33.3%) | |
| Janajati | 39 (63.9%) | 22 (36.1%) | |
| Madheshi/muslim | 20 (76.9%) | 6 (23.1%) | |
| Family type | |||
| Nuclear/single | 57 (72.2%) | 22 (27.8%) | 0.751 |
| Extended/joint | 39 (69.6%) | 17 (30.4%) | |
| Father’s education | |||
| Illiterate | 7 (70%) | 3 (30%) | 0.571 |
| Primary level | 13 (68.4%) | 6 (31.6%) | |
| Secondary level | 34 (79.1%) | 9 (20.9%) | |
| More than sec/higher sec | 42 (66.7%) | 21 (33.3%) | |
| Mother’s education | |||
| Illiterate | 12 (80%) | 3 (20%) | 0.237 |
| Primary level | 22 (75.9%) | 7 (24.1%) | |
| Secondary level | 33 (76.7%) | 10 (23.3%) | |
| More than sec/higher sec | 29 (60.4%) | 19 (39.6%) | |
| Family monthly income (Rs) | |||
| 10000-50000 | 19 (79.2%) | 5 (20.8%) | 0.337 |
| 50001-150000 | 77 (69.4%) | 34 (30.6%) | |
Table 07: Association between life style characteristics of public schools
| Life-style characteristics | Public schools | ||
| Underweight/normal | Overweight/obese | p-value | |
| N (%) | N (%) | ||
| Physically active for 60 minutes | |||
| 1-3 days | 60 (84.5%) | 11 (15.5%) | 0.918 |
| All 7 days | 73 (83.9%) | 14 (16.1%) | |
| Physical exercise to strengthen muscle | |||
| 1-5 days | 98 (85.2%) | 17 (14.8%) | 0.558 |
| All 7 days | 35 (81.4%) | 8 (18.6%) | |
| Time spending by walking/bicycling | |||
| < 30 minutes | 52 (86.7%) | 8 (13.3%) | 0.791 |
| 30-60 minutes | 49 (83.1%) | 10 (16.9%) | |
| 60-120 minutes | 32 (82.1%) | 7 (17.9%) | |
| Physical education class | |||
| Yes | 19 (76%) | 6 (24%) | 0.222 |
| No | 114 (85.7%) | 19 (14.3%) | |
| Days of having physical education class | |||
| Once a week | 14 (70%) | 6 (30%) | 0.160 |
| Twice a week | 5 (100%) | – | |
| Sports day in school | |||
| Yes | 91 (79.8%) | 23 (20.2%) | 0.016* |
| No | 42 (95.5%) | 2 (4.5%) | |
| Playing sports | |||
| Once a week | 18 (85.7%) | 3 (14.3%) | 0.758 |
| Twice a week | 62 (78.5%) | 17 (21.5%) | |
| All 7 days | 11 (78.6%) | 3 (21.4%) | |
| Helping parents | |||
| Always | 113 (83.1%) | 23 (16.9%) | 0.351 |
| Sometimes | 20 (90.9%) | 2 (9.1%) | |
| Habit of smoking | |||
| Yes | 6 (100%) | – | 0.279 |
| No | 127 (83.6%) | 25 (16.4%) | |
| Drinking alcohol/beer/wine | |||
| Yes | 10 (83.3%) | 2 (16.7%) | 0.934 |
| No | 123 (84.2%) | 23 (15.8%) | |
| Exposure to screen time | |||
| < 1hour | 39 (92.9%) | 3 (7.1%) | 0.038* |
| 2-4 hours | 82 (83.7%) | 16 (16.3%) | |
| > 4 hours | 12 (66.7%) | 6 (33.3%) | |
| Eating food using mobile/other electronic devices | |||
| Often | 118 (84.9%) | 21 (15.1%) | 0.505 |
| Always | 15 (78.9%) | 4 (21.1%) | |
Table 08: Association of overweight/obese with lifestyle characteristics of private schools
| Life style characteristics | Private schools | ||
| Underweight/normal
N (%) |
Overweight/obese
N (%) |
p-value | |
| Physically active for 60 minutes | |||
| 1-3 days | 53 (67.1%) | 26 (32.9%) | 0.221 |
| All 7 days | 43 (76.8%) | 13 (23.2%) | |
| Physical exercise to strengthen muscle | |||
| 1-5 days | 76 (72.4%) | 29 (27.6%) | 0.543 |
| All 7 days | 20 (66.7%) | 10 (33.3%) | |
| Time spending by walking/bicycling | |||
| < 30 minutes | 28 (63.6 %) | 16 (36.4%) | 0.352 |
| 30-60 minutes | 49 (73.1%) | 18 (26.9%) | |
| 60-120 minutes | 19 (79.2%) | 5 (20.8%) | |
| Physical education class | |||
| Yes | 67 (69.1%) | 30 (30.9%) | 0.404 |
| No | 29 (76.3%) | 9 (23.7%) | |
| Days of having physical education class | |||
| Once a week | 48 (75%) | 16 (25%) | 0.079 |
| Twice a week | 19 (57.6%) | 14 (42.4%) | |
| Playing sports | |||
| Once a week | 28 (80%) | 7 (20%) | 0.285 |
| Twice a week | 46 (70.8%) | 19 (29.2%) | |
| All 7 days | 22 (62.9%) | 13 (37.1%) | |
| Helping parents | |||
| Always | 69 (69.7%) | 30 (30.3%) | 0.548 |
| Sometimes | 27 (75%) | 9 (25 %) | |
| Habit of smoking | |||
| Yes | 6 (75%) | 2 (25%) | 0.802 |
| No | 90 (70.9%) | 37 (29.1%) | |
| Habit of drinking alcohol/beer/wine | |||
| Yes | 26 (72.2%) | 10 (27.8%) | 0.864 |
| No | 70 (70.7%) | 29 (29.3%) | |
| Exposure to screen time | |||
| < 1hour | 18 (69.2%) | 8 (30.8%) | 0.370 |
| 2-4 hours | 65 (69.1%) | 29 (30.9%) | |
| >4 hours | 13 (86.7%) | 2 (13.3%) | |
| Eating food using mobile/other electronic devices | |||
| Often | 76 (71.7%) | 30 (28.3%) | 0.774 |
| Always | 20 (69%) | 9 (31%) | |
Table 09: Association of overweight/obesity with dietary pattern in public schools
| Dietary pattern | Public schools | ||
| Underweight/normal
N (%) |
Overweight/obese
N (%) |
p-value | |
| Intake of pulses | |||
| Daily | 114 (85.7%) | 19 (14.3%) | 0.222 |
| Alternative | 19 (76%) | 9 (24%) | |
| Veg/non-veg | |||
| Vegetarian | 15 (88.2%) | 2 (11.8%) | 0.627 |
| Non-Veg | 118 (83.7%) | 23 (16.3%) | |
| If non-veg, intake of meat | |||
| Daily | 11 (40.7%) | 16 (59.3%) | <0.001** |
| Alternative | 45 (90%) | 5 (10%) | |
| Twice a week | 62 (96.9%) | 2 (3.1%) | |
| Intake of eggs | |||
| Daily | 18 (72%) | 7 (28%) | 1.27 |
| Alternative | 26 (86.7%) | 4 (13.3%) | |
| Once a week | 41 (82%) | 9 (18%) | |
| Twice a week | 40 (93%) | 3 (7%) | |
| Intake of fish | |||
| Once a week | 32 (88.9%) | 4 (11.1%) | 0.399 |
| Twice a month | 93 (83%) | 19 (17%) | |
| Intake of milk and milk products | |||
| Daily | 99 (83.9%) | 19 (16.1%) | 0.869 |
| Alternative | 34 (85%) | 6 (15%) | |
| Intake of seasonal vegetables in a week | |||
| < 5 days | 88 (82.2%) | 19 (17.8%) | 0.335 |
| > 5 days | 45 (88.2%) | 6 (11.8%) | |
| Intake of other vitamin A rich fruits and vegetables | |||
| Always | 33 (80.5%) | 8 (19.5%) | 0.452 |
| At least 3 times/week | 100 (85.5%) | 17 (14.5%) | |
| Days of eating other fruits | |||
| < 3 days | 99 (83.9%) | 19 (16.1%) | 0.869 |
| > 3 days | 34 (85%) | 6 (15%) | |
| Serving of fruits on a day | |||
| < 2 servings | 113 (83.1%) | 23 (16.9%) | 0.351 |
| > 2 servings | 20 (90.9%) | 2 (9.1%) | |
| Intake of nuts | |||
| Daily | 11 (78.6%) | 3 (21.4%) | 0.547 |
| Sometimes | 122 (84.7%) | 22 (15.3%) | |
| Processed/fast food | |||
| Daily | 115 (83.9%) | 22 (16.1%) | 0.836 |
| Sometimes | 18 (85.7%) | 3 (14.3%) | |
| Carbonated drinks within 7 days | |||
| 1-3 times | 124 (83.8%) | 24 (16.2%) | 0.602 |
| 4-6 times | 9 (90%) | 1 (10%) | |
| Food at restaurant | |||
| Alternative | 31 (88.6%) | 4 (11.4%) | 0.170 |
| Sometimes | 68 (87.2%) | 10 (12.8%) | |
| Never | 34 (75.6%) | 11 (24.4%) | |
| Food from outside at home | |||
| Alternative | 21 (80.8%) | 5 (19.2%) | 0.265 |
| Sometimes | 66 (89.2%) | 8 (10.8%) | |
| Never | 46 (79.3%) | 12 (20.7%) | |
| Drinking water | |||
| 1-4 glasses | 83 (62.4%) | 15 (60%) | 0.82 |
| 5-6 glasses | 50 (37.6%) | 10 40%) | |
Table 10: Association of overweight/obesity with dietary pattern in private schools
| Dietary pattern | Private schools | ||
| Underweight/normal | Overweight/obese | p-value | |
| N (%) | N (%) | ||
| Intake of pulses | |||
| Daily | 59 (70.2%) | 25 (29.8%) | 0.774 |
| Alternative | 37 (72.5%) | 14 (27.5%) | |
| Veg/non-veg | |||
| Vegetarian | 6 (60%) | 4 (40%) | 0.420 |
| Non-Vegetarian | 90 (72%) | 35 (28%) | |
| If non-veg, intake of meat | |||
| Daily | 17 (85%) | 3 (15%) | 0.191 |
| Alternative | 36 (75%) | 12 (25%) | |
| Twice a week | 37 (64.9%) | 20 (35.1%) | |
| Intake of eggs | |||
| Daily | 22 (62.9%) | 13 (37.1%) | 0.477 |
| Alternative | 35 (74.5%) | 12 (25.5%) | |
| Once a week | 21 (72.4%) | 8 (27.6%) | |
| Twice a week | 14 (82.4%) | 3 (17.6%) | |
| Intake of fish | |||
| Once a week | 18 (69.2%) | 8 (30.8%) | 0.737 |
| Twice a month | 74 (72.5%) | 28 (27.5%) | |
| Milk consumption | |||
| Daily | 83 (70.9%) | 34 (29.1%) | 0.911 |
| Alternative | 13 (72.2%) | 5 (27.8%) | |
| Intake of seasonal vegetables | |||
| < 5 days | 152 (76%) | 48 (24%) | 0.190 |
| > 5 days | 77 (82.8%) | 16 (17.2%) | |
| Intake of other vitamin A rich fruits and vegetables | |||
| Always | 62 (72.1%) | 24 (27.9%) | 0.739 |
| At least 3 days /week | 34 (69.4%) | 15 (30.6%) | |
| Days of eating other fruits | |||
| < 3 days | 56 (73.7%) | 20 (26.3%) | 0.454 |
| > 3 days | 40 (67.8%) | 19 (32.2%) | |
| Serving of fruits in a day | |||
| < 2 servings | 60 (71.4%) | 24 (28.6%) | 0.917 |
| > 2 servings | 36 (70.6%) | 15 (29.4%) | |
| Intake of nuts | |||
| Daily | 19 (61.3%) | 12 (38.7%) | 0.169 |
| Sometimes | 77 (74%) | 27 (26%) | |
| Fast food | |||
| Daily | 63 (77.8%) | 18 (22.2%) | 0.036* |
| Sometimes | 33 (61.1%) | 21 (38.9%) | |
| Carbonated drinks | |||
| 1-3 times | 91 (70%) | 39 (30%) | 0.146 |
| 4-6 times | 5 (100%) | – | |
| Food at restaurant | |||
| Alternative | 11 (73.3%) | 4 (26.7%) | 0.926 |
| Sometimes | 76 (70.4%) | 32 (29.6%) | |
| Never | 9 (75%) | 3 (25%) | |
| Food from outside at home | |||
| Alternative | 13 (61.9%) | 8 (38.1%) | 0.557 |
| Sometimes | 67 (72%) | 26 (28%) | |
| Never | 16 (76.2%) | 5 (23.8%) | |
| Drinking water | |||
| 1-4 glasses | 51 (71.8%) | 20 (28.2%) | 0.846 |
| 5-6 glasses | 45 (70.3%) | 19 (29.7%) | |
Table 11: Association of overweight/obese with 24-hour dietary recall of public school’s students
| Variables | Public schools | ||
| Underweight/normal
N (%) |
Overweight/obese
N (%) |
p-value | |
| Protein
Adequate Inadequate |
69 (71.1%) 30 (90.9%) |
28 (28.9%) 3 (9.1%) |
0.021* |
| Fats
Adequate Inadequate |
66 (72.5%) 33 (84.6%) |
25 (27.5%) 6 (15.4%) |
0.138 |
| Carbohydrate
Adequate Inadequate |
95 (75.4%) 4 (100%) |
31 (24.6%) – |
0.256 |
| Total energy
Adequate Inadequate |
13 (56.5%) 86 (80.4%) |
10 (43.5%) 21(19.6%) |
0.015* |
| Minimum dietary diversity | |||
| < 5 food groups
> 5 food groups |
104 (78.2%)
29 (21.8%) |
17 (68%)
8 (32%) |
0.269 |
| Fast food
Yes No |
94 (75.2%) 5 (100%) |
31 (24.8%) – |
0.202 |
Table 12: Association of overweight/obese with macronutrients of private schools
| Variables | Private schools | ||
| Underweight/Normal
N (%) |
Overweight/Obese
N (%) |
p-value | |
| Protein
Adequate Inadequate |
77 (67%) 19 (95%) |
38 (33%) 1 (5%) |
0.011* |
| Fats
Adequate Inadequate |
74 (70.5%) 22 (73.3%) |
31 (29.5%) 8 (26.7%) |
0.761 |
| Total energy
Adequate Inadequate |
18 (58.1%) 78 (75%) |
13 (41.9%) 26 (25%) |
0.068 |
| Minimum dietary diversity | |||
| < 5 food groups
> 5 food groups |
67 (69.8%)
29 (30.2%) |
26 (66.7%)
13 (33.3%) |
0.722 |
| Fast food
Yes No |
94 (96.9%) 2 (66.7%) |
38 (28.8%) 1 (33.3%) |
0.864 |
Table 13: Binary logistic regression of public and private schools with overweight/obesity
| Nutritional category | |||||
| Type of school | Underweight/normal
N (%) |
Overweight/obese
N (%) |
p-value | Odd’s Ratio | COR (95% CI) |
| Public | 133 (84.2%) | 25 (15.8%) |
0.008 |
1 | |
| Private | 96 (71.1%) | 39 (28.9%) | 2.161 | 1.226-3.809 | |
Table 14: Binary logistic regression of socio-demographic characteristics, Life-style and dietary pattern and 24 hr. dietary recall of public and private schools
| Variables
|
Nutritional category | |||
| Underweight/normal | Overweight/obese | COR (95% CI) | p-value | |
| N (%) | N (%) | |||
| Age of the respondents | ||||
| 13-15 | 164 (75.9%) | 52 (24.1%) | 1.71 (0.861-3.425)
1 |
0.122 |
| 16-18 | 65 (84.4%) | 12 (15.6%) | ||
| Sex | ||||
| Male | 126 (78.8%) | 34 (21.3%) | 1
1.079 (0.619-1.882) |
0.788 |
| Female | 103 (77.4%) | 30 (22.6%) | ||
| Grade | ||||
| 8 | 99 (76.2%) | 31 (23.8%) | 1.234 (0.708-2.150)
1 |
0.459 |
| 9 | 130 (79.8%) | 33 (20.2%) | ||
| Ethnicity | ||||
| Brahmin/chhetri | 45 (83.3%) | 9 (16.7%) | 1 | |
| Dalit | 46 (78%) | 13 (22%) | 2.097 (0.897-4.904) | 0.088 |
| Janajati | 62 (70.5%) | 26 (29.5%) | 0.833 (0.159-4.379) | 0.829 |
| Madheshi/muslim | 76 (82.6%) | 16 (17.4%) | 1.094 (0.436-2.745) | 0.849 |
| Family type | ||||
| Nuclear | 145 (80.1%) | 36 (19.9%) | 1.34 (0.765-2.356) | 0.304 |
| Joint/extended | 84 (75%) | 28 (25%) | 1 | |
| Father’s education | ||||
| Illiterate | 67 (87%) | 10 (13%) | 1 | |
| Primary level | 38 (76%) | 12 (24%) | 2.116 (0.836-5.56) | 0.114 |
| Secondary level | 53 (79.1%) | 14 (20.9%) | 1.770 (0.728-4.301) | 0.208 |
| More than Sec/higher sec | 71 (71.7%) | 28 (28.3%) | 2.64 (1.19-5.854) | 0.017* |
| Mother’s education | ||||
| Illiterate | 76 (87.4%) | 11 (12.6%) | 1 | |
| Primary level | 45 (76.3%) | 14 (23.7%) | 2.15 (0.899-5.138) | 0.085 |
| Secondary level | 54 (78.3%) | 15 (21.7%) | 1.92 (0.818-5.502) | 0.134 |
| More than Sec/higher sec | 54 (69.2%) | 24 (30.8%) | 3.071 (1.388-6.795) | 0.006* |
| Family monthly income (Rs) | ||||
| 10,000-50,000 | 130 (85.5%) | 22 (14.5%) | 1 | |
| 50,001-150,000 | 99 (70.2%) | 42 (29.8%) | 2.51 (1.406-4.470) | 0.002* |
| Life-style characteristics | ||||
| Physically active | ||||
| 1-3 days
All 7 days |
113 (75.3%)
116 (81.1%) |
37 (24.7%)
27 (18.9%) |
1.407 (0.804-2.462)
1 |
0.231 |
| Physical exercise | ||||
| 1-5 days
All 7 days |
174 (79.1%)
55 (75.3%) |
46 (20.9%)
18 (24.7%) |
1
1.24 (0.664-2.309) |
0.502 |
| Time spends for cycling & walking | ||||
| < 30 min
> 30-60 min 60-120 min |
80 (76.9%)
98 (77.8%) 51 (81%) |
24 (23.1%)
28 (22.2%) 12 (19%) |
1
1.275 (0.586-2.773) 1.214 (0.570-2.587) |
0.822
0.540 0.615 |
| Physical education class | ||||
| Yes
No |
86 (70.5%)
143 (83.6%) |
36 (29.5%)
28 (16.4%) |
2.14 (1.219-3.749)
1 |
0.007* |
| Days of having physical education class | ||||
| Once a week
Twice a week |
62 (73.8%)
24 (63.2%) |
22 (61.1%)
14 (36.8%) |
0.608 (0.268-1.380)
1 |
0.232 |
| Sports day in school | ||||
| Yes
No |
187 (75.1%)
42 (95.5%) |
62 (24.9%)
2 (4.5%) |
6.96 (1.638-29.602)
1 |
0.009* |
| Playing sports | ||||
| Once a week
Twice a week All 7 days |
46 (82.1%)
108 (75%) 33 (67.3%) |
10 (17.9%)
36 (25%) 16 (32.7%) |
1
1.53 (0.702-3.348) 2.23 (0.900-5.525) |
0.283 0.083 |
| Helping parents | ||||
| Always
Sometimes |
182 (77.4%)
47 (81%) |
53 (22.6%)
11 (19%) |
1.244 (0.603- 2.567)
1 |
0.554 |
| Screen time | ||||
| < 1 hour
2-4 hour > 4 hours |
57 (83.8%)
147 (76.6%) 25 (75.8%) |
11 (16.2%)
45 (23.4%) 8 (24.2%) |
1
1.59 (0.767-3.281) 1.658 (0.595-4.621) |
0.213 0.333 |
| Eating food using mobile devices | ||||
| Often
Always |
194 (79.2%)
35 (72.9%) |
51 (20.8%)
13 (27.1%) |
1
1.413 (0.696-2.866) |
0.338 |
| Habit of smoking | ||||
| Yes
No |
12 (85.7%)
217 (77.8%) |
2 (14.3%)
62 (22.2%) |
1
1.714 (0.374-7.864) |
0.488 |
| Habit of drinking alcohol/beer/wine | ||||
| Yes
No |
36 (75%)
193 (78.8%) |
12 (18.8%)
52 (21.8%) |
1
0.808 (0.393-1.663) |
0.563 |
| Dietary pattern | ||||
| Intake of pulses | ||||
| Daily
Alternative |
173 (79.7%)
56 (73.7%) |
44 (20.3%)
20 (26.3%) |
1
1.404 (0.764-2.580) |
0.274 |
| Veg/non-veg | ||||
| Vegetarian
Non-vegetarian |
21 (77.8%)
208 (78.2%) |
6 (22.2%)
58 (21.8%) |
1.025 (0.395-2.657)
1 |
0.960
|
| Frequency of intake of meat | ||||
| Daily
Alternative Twice a week |
28 (59.6%)
81 (82.7%) 99 (81.8%) |
19 (40.4%)
17 (17.3%) 22 (18.2%) |
1.186 (0.520-2.706)
1.033 (0.418-2.554) 1 |
0.685 |
| Frequency of intake of eggs | ||||
| Daily
Alternative Once a week Twice a week |
40 (66.7%)
61 (79.2%) 62 (78.5%) 54 (90%) |
20 (33.3%)
16 (20.8%) 17 (21.5%) 6 (10%) |
4.5 (1.65-12.22)
2.361 (0.862-6.463) 2.47 (0.908-6.706) 1 |
0.003*
0.095 0.077 |
| Frequency of intake of fish | ||||
| Once a week
Twice a month |
50 (80.6%)
167 (78%) |
12 (19.4%)
47 (22%) |
1
1.173 (0.578-2.381) |
0.659 |
| Frequency of drinking milk | ||||
| Daily
Alternative |
182 (77.4%)
47 (81%) |
53 (22.6%)
11 (19%) |
1.24 (0.603-2.567)
1 |
0.554 |
| Days of eating seasonal vegetables & fruits | ||||
| < 5 days
> 5 days |
152 (76%)
77 (82.8%) |
48 (24%)
16 (17.2%) |
1.52 (0.810-2.850)
1 |
0.192 |
| Frequency of intake of vitamin A rich fruits & vegetables | ||||
| Always
At least 3 times/week |
95 (74.8%)
134 (80.7%) |
32 (25.2%)
32 (19.3%) |
1.41 (0.809-2.460)
1 |
0.225 |
| Days of eating other fruits | ||||
| < 3 days
> 3 days |
155 (79.9%)
74 (74.7%) |
39 (20.1%)
25 (25.3%) |
1
1.34 (0.757-2.382) |
0.314 |
| Servings of fruits/day | ||||
| < 2 Servings
> 2 Servings |
173 (78.6%)
56 (76.7%) |
47 (21.4%)
17 (23.3%) |
1
1.12 (0.594-2.101) |
0.730 |
| Intake of nuts | ||||
| Daily
Sometimes |
30 (66.7%)
199 (80.2%) |
15 (33.3%)
49 (19.8%) |
2.031 (1.014-4.065)
1 |
0.045* |
| Intake of fast food | ||||
| Daily
Sometimes |
178 (81.7%)
51 (68%) |
40 (18.3%)
24 (32%) |
1
2.094 (1.156-3.793) |
0.015* |
| Frequency of eating food at restaurant | ||||
| Alternative
Sometimes Never |
42 (84%)
144 (77.4%) 43 (75.4%) |
8 (16%)
42 (22.6%) 14 (24.6%) |
1
1.53 (0.667-3.514) 1.709 (0.650-4.496) |
0.315 0.277 |
| Frequency of intake of food from outside at home | ||||
| Alternative
Sometimes Never |
34 (72.3%)
133 (79.6%) 62 (78.5%) |
13 (27.7%)
34 (20.4%) 17 (21.5%) |
1.394 (0.605-3.212)
0.932 (0.484-1.796) 1 |
0.565
0.435 |
| Drinking carbonated drinks | ||||
| 1-3 times/servings
4-6 times/servings |
215 (77.3%)
14 (93.3 %) |
63 (22.7%)
1 (6.7%) |
4.102 (0.529-31.806)
1 |
0.177 |
| Drinking water | ||||
| 1-4 glasses
5-6 glasses |
134 (79.3%)
95 (76.6%) |
35 (20.7%)
29 (23.4%) |
1
1.17 (0.669-2.042) |
0.584 |
| Macro-nutrients variables (24 hr. dietary recall) | ||||
| Protein
Adequate Inadequate |
155 (72.3%) 75 (93.8%) |
59 (27.7%) 5 (6.3%) |
5.75 (2.214-14.915) 1 |
<0.001** |
| Fats
Adequate Inadequate |
144 (73.1%) 85 (88.5%) |
53 (26.9%) 11 (11.5%) |
2.844 (1.409-5.742) 1 |
0.004* |
| Total energy
Adequate Inadequate |
30 (56.6%) 199 (82.9%) |
23 (43.4%) 41 (17.1%) |
3.72 (1.964-7.049) 1 |
<0.001** |
| Fast food
Yes No |
214 (77.5%) 15 (88.2%) |
62 (22.5%) 2 (11.8%) |
2.17 (0.484-9.760) 1 |
0.311 |
Table 15: Multiple regression analysis of overweight/obese with associated factors
| Variables
|
Overweight/obese | |
| Adjusted OR (95 %CI) | p-value | |
| Type of school | ||
| Public | 1 | |
| Private | 0.463 (0.173-1.237) | 0.124 |
| Father’s education | ||
| Illiterate | 1 | |
| Primary level | 0.735 (0.175-3.077) | 0.673 |
| Secondary level | 0.218 (0.041-1.170) | 0.076 |
| More than secondary/higher secondary | 0.176 (0.029-1.068) | 0.059 |
| Mother’s education | ||
| Illiterate | 1 | |
| Primary level | 3.011 (0.765-11.859) | 0.115 |
| Secondary level | 4.296 (0.915-20.176) | 0.065 |
| More than secondary/higher secondary | 5.793 (1.070-31.357) | 0.041* |
| Monthly income | ||
| 10,000-50,000 | 1 | |
| 50,001-150,000 | 2.232 (0.882-5.648) | 0.090 |
| Physical education class | ||
| Yes | 1.693 (0.747-3.833) | 0.207 |
| No | 1 | |
| Sports day in school | ||
| Yes | 2.932 (0.585-14.706) | 0.191 |
| No | 1 | |
| Frequency of intake of eggs | ||
| Daily | 5.015 (1.600-15.723) | 0.006* |
| Alternative | 2.881 (0.930-8.926) | 0.067* |
| Once a week | 3.704 (1.174-11.688) | 0.026* |
| Twice a week | 1 | |
| Frequency of intake of nuts | ||
| Daily | 1.268 (0.556-2.889) | 0.572 |
| Sometimes | 1 | |
| Frequency of intake of fast/processed food | ||
| Daily | 1 |
0.044* |
| Sometimes | 2.212 (1.020-4.793) | |
| Macronutrients Variables | ||
| Protein
Adequate Inadequate |
5.465 (1.518-19.683) 1 |
0.009* |
| Fats
Adequate Inadequate |
1.152 (0.432-3.073) 1 |
0.778 |
| Total Energy
Adequate Inadequate |
2.431 (1.096-5.391) 1 |
0.029* |
In this study, prevalence of severe thin was 2.4% followed by 14.7% of thin, less than two third (61.1%) were normal, 17.1% overweight and 4.8% obese which is consistent with the findings of the study prevailed in Duhok district, Iraq [16] which stated that the prevalence of severe thin 0.8%, thin 5.4% ,10.8% obese and 17.4% overweight. However, the findings of the current data were in contrast to data of NDHS which was 26% in adolescent girls and 41% among adolescent boys 15-19 years [17]. On other hand, it is in contrast to the study conducted in Delta State, Nigeria [18], where the occurrence of underweight in public and private school was 29% in both schools (p <0.030). However, this finding is slightly higher than another study conducted in sub metropolitan city of Hetauda which outlined prevalence of overweight as 9.31% [19]. Thus, the variation of underweight in various countries and other district of Nepal might be due to differences in the study setting of different schools, different age groups with different food habits of adolescents included in the study as well as the methodologies applied in the study purpose. In addition, other factors associated with overweight/obesity among adolescent was exposure to screen time for more than 4 hours (p=0.038), intake of meat (p <0.001) at 95% CI which is similar to the study conducted Lebanon that specified more exposure to smart phone screen time (>2hrs) was a significant increase in BMI (p=0.048). Furthermore, it is supported by the research conducted in Iran, [20] which stated intake of meat and poultry was highly associated with central obesity (p < 0.001). This might be due to generation of digital era and attraction towards fast foods than home based food. An associated factor with overweight/obesity among adolescent in private schools was fast-food consumption with p < 0.05 at 95% CI which is consistent to study conducted by [21] and [20]. This might be due higher intake of overdose of calories, unhealthy food and high take of sugary items when they eat it occasionally. The study also revealed that intake of seasonal vegetables for less than 5 days was 24% overweight/obese and intake of vitamin a fruits and vegetables for at least 3 days was 30.6% overweight/obese. Moreover, 19.2% of people who ate meals from outside at home instead were obese or overweight which is parallel to the research conducted by [22] stated that those eating food from outside at home were more than one third (38.1%) overweight/obese than those who never eat food from outside at home. It may be due to students in private schools might come from higher socio-economic backgrounds which influences their lifestyle and dietary habits which may leads to increase in overweight/obesity. The present study focuses on to assessed the factors associated with overweight/obesity among adolescents. It revealed that there was a significant association between type of schools and overweight/obesity. Private school adolescents were significantly associated with overweight/obese being 2.16 times higher (COR = 2.161, 95% CI 1.226-3.809; p=0.008) than public school adolescents which is similar to the study of [23] where a higher prevalence of overweight/obesity in adolescents (p < 0.001) attending private schools compared to public schools.
- CONCLUSIONS
The results of the study, which was done among adolescents at KMC’s public and private schools, showed that the prevalence of overweight and obesity is higher in private schools than in public schools, at 22% vs. 12.7%. Teenagers in private schools were shown to be substantially (p=0.008) more likely to be overweight or obese than those in public schools. Of the 293 participants, 2.4% were found to be extremely thin, followed by 14.7% who were thin, 61.1% were normal, 17.1% were overweight, and 4.8% who obese. Males were found to be more obese than females. In binary logistic regression, father’s education, mother’s education, family income, sports day, physical education was found to be significantly associated with overweight/obesity. Moreover, less than 30 minutes of walking or cycling and more than four hours of screen time have been linked to lifestyle factors associated with being overweight or obese. Private school’s adolescents consumed >5 food groups compared to that of public schools’ adolescents. In multivariate analysis, dietary factors like nuts, processed/fast food and intake of eggs were associated with overweight/obesity in adolescents, the relationships can be complex and multifaceted. Under 24-hour recall diet, the significant associations between adequate protein and energy intake with overweight/obesity underscore the complexity of dietary influences on weight status. It’s crucial to interpret these findings in the context of overall dietary patterns, lifestyle behaviors, and individual differences. The study highlights the disparities in nutritional status between adolescents in public and private schools in KMC and underscores the need for comprehensive strategies to address these disparities. It emphasizes the importance of considering dietary factors in addressing overweight/obesity among adolescents. Overall, the study provides insights into the complex interplay of socio-demographic, physical activity, and dietary factors and 24-hour dietary recall influencing the nutritional status among adolescents and focuses the need for tailored interventions to address the issue of overweight and obesity in this population.
REFERENCES
- United Nations Children’s Fund. (2006). The state of the world’s children 2006: Excluded and invisible. https://www.unicef.org/sowc06/pdfs/sowc06_fullreport.pdf CRIN+1
- Khan, N. M., Ahmed Robin, S., Khabir, L., & Mahmud, S. (2024). Role of vitamin C in development of age related cataract. Dinkum Journal of Medical Innovations, 3(01), 26 34.
- United Nations Children’s Fund. (2009). Tracking progress on child and maternal nutrition: A survival and development priority. https://resourcecentre.savethechildren.net/document/tracking-progress-child-and-maternal-nutrition-survival-and-development-priority/ Save the Children’s Resource Centre
- World Health Organization. (2000). Nutrition for health and development: A global agenda for combating malnutrition (WHO/NHD/00.6). https://iris.who.int/handle/10665/66509 Iris
- World Health Organization. (2001). The second decade: Improving adolescent health and development.
- Madhu, S. R. (2024). A study on anaemia in adolescent girls due to food habit at Gazipur District in Bangladesh. Dinkum Journal of Medical Innovations, 3(06), 469 482.
- Abdulrahman, M. A., & Sadeeq, H. A. (2022). Nutritional status of school going adolescents in urban and rural areas in the Duhok District. [Journal name and volume/issue not provided, URL: http://apps.searo.who.int/PDS_DOCS/B0239.pdf]
- Afe, J., et al. (2023). Nutritional status of adolescents in public and private secondary schools in Asaba, Delta State, Nigeria. European Journal of Nutrition & Food Safety.
- Centres for Disease Control and Prevention. (2019). [Title not provided]. https://www.cdc.gov/fact_sheets/tobacco_industry [Exact fact sheet title should be added]
- Chaudhary, A., Pokale, A., Narual, P. A., Chaudhary, B., Misra, A., & Jain, A. (2019). Assessment of overweight and obesity among urban adolescents. International Journal of Contemporary Pediatrics.
- Thapa, N., Gartaula, P., & Thakuri, P. C. (2024). Knowledge of hygienic food handling practices among street food vendors in Dhading Besi, District Dhading, Nepal. Dinkum Journal of Medical Innovations, 3(01), 35 51.
- Food and Agriculture Organization & United States Agency for International Development. (2016). Minimum dietary diversity for women: A guide for measurement. FAO. https://www.fao.org/publications
- Kamaleddine, A. N., Antar, H. A., Ali, B. T., Hammoud, S. F., Lee, J., Lee, T., … Salameh, P. (2022, March 22). Effect of screen time on physical and mental health and eating habits during COVID 19 lockdown in Lebanon. Korean Neuropsychiatric Association.
- Khatri, E., Baral, K., Arjyal, A., Yadav, R. K., & Baral, S. (2023, March 6). Prevalence of and risk factors for overweight among adolescents of a sub metropolitan city of Nepal. PLOS ONE. https://doi.org/10.1371/journal.pone.0270777
- Nepal Demographic and Health Survey. (2022).
- Pokale, (2022). Assessment of overweight and obesity. International Journal of Contemporary Healthcare.
- Okeyo, P. A., Seekoe, E., de Villiers, A., Faber, M., Nel, H. J., & Steyn, P. N. (2020, August 13). Dietary practices and adolescent obesity in secondary school learners at disadvantaged schools in South Africa: Urban rural and gender differences. International Journal of Environmental Research and Public Health.
- Azure, A. A., Agbozo, F. A., & Zotor, F. B. (2024). Child nutrition and health indicators as predictors of academic performance among primary school children in Binduri District, Ghana. Dinkum Journal of Medical Innovations, 3(10), 670 689.
- Rana, K., Ghimire, P., Chimoriya, R., & Chimoriya, R. (2021, September 2). Trends in the prevalence of overweight and obesity and associated socioeconomic and household environmental factors among women in Nepal: Findings from the Nepal Demographic Health Surveys. MDPI.
- Ruiz, L. D., Zuelch, M. L., Dimitratos, S. M., & Scherr, R. E. (2019, December 23). Adolescent obesity: Diet quality, psychosocial health, and cardiometabolic risk factors. Nutrients (MDPI).
- Shakya, T., Jha, C., & Sharma, S. (2023, March). Overweight and obesity among early adolescents from … European Journal of Pharmaceutical and Medical Research. URL: www.ejpmr.com]
- Chaudhary, A., Pokale, A., Narual, P. A., Chaudhary, B., Misra, A., & Jain, A. (2019). Assessment of overweight and obesity among urban adolescents. International Journal of Contemporary Pediatrics.
- Thapa, N., Gartaula, P., & Thakuri, P. C. (2024). Knowledge of hygienic food‑handling practices among street food vendors in Dhading Besi, District Dhading, Nepal. Dinkum Journal of Medical Innovations, 3(01). 35‑51.
Publication History
Submitted: April 05, 2025
Accepted: April 20, 2025
Published: May 31, 2025
Identification
D-0426
DOI
https://doi.org/10.71017/djmi.4.5.d-0426
Citation
Ruby Manandhar & Raj Kumar Sangroula (2025). Factors Associated with Nutritional Status among Adolescents of Kathmandu Metropolitan City: A Comparative Study Between Public and Private Schools. Dinkum Journal of Medical Innovations, 4(05):273-297.
Copyright
© 2025 The Author(s).