

Publication History
Submitted: October 25, 2025
Accepted: November 08, 2025
Published: November 30, 2025
Identification
D-0548
DOI
https://doi.org/10.71017/djmi.4.11.d-0548
Citation
Sanjay Prasad Sah, Noor Alam Ansari, Mohammed Atiqur Rahman, Shamim Ahmed, Rajashish Chakrabortty & Palash Debnath (2025). Diagnostic Usefulness of Pleural Fluid CA-125 and CEA Compared to Serum CA-125 and CEA in Malignant Pleural Effusion. Dinkum Journal of Medical Innovations, 4(11):755-769.
Copyright
© 2025 The Author(s).

755-769
Diagnostic Usefulness of Pleural Fluid CA-125 and CEA Compared to Serum CA-125 and CEA in Malignant Pleural EffusionOriginal Article
Sanjay Prasad Sah 1*, Noor Alam Ansari 2, Mohammed Atiqur Rahman 3, Shamim Ahmed 4, Rajashish Chakrabortty 5, Palash Debnath 6
- Manmohan Memorial Medical College & Hospital, Swayambhu, Nepal.
- Patan Academy of Health Sciences (PAHS), Patan Hospital, Lalitpur, Nepal.
- Bangladesh Medical University (BMU), Bangladesh.
- Bangladesh Medical University (BMU), Bangladesh.
- Bangladesh Medical University (BMU), Bangladesh.
- National Institute of the Diseases of the Chest & Hospital, Dhaka, Bangladesh
* Correspondence: spsah1986@gmail.com
Abstract: Malignant Pleural Effusion (MPE) is a form of pleural effusion that is frequently encountered in our respiratory medicine department. The diagnosis of malignant pleural effusion is a difficult task due to lack of sensitivity of different standard tools. The study established the diagnostic usefulness of pleural fluid CA-125 and CEA compared to serum CA-125 and CEA in malignant pleural effusion. This cross-sectional study was conducted in the Department of Respiratory Medicine of Bangabandhu Sheikh Mujib Medical University (BSMMU), Dhaka, Bangladesh. The study consisted of N=62 patients with pleural effusion (both malignant and non-malignant). The diagnosis of pleural effusion was based on clinical, radiological, and histological examinations. Then the sensitivity, specificity, positive predictive value, negative predictive value, and diagnostic odds ratio along with ROC curve of serum and pleural fluid CA-125 and CEA were investigated for the diagnosis of malignant pleural effusion. The mean age of the 62 respondents was 56.5 (SD ±11.4) years old, and 74.1% respondents were male. There were 52% malignant pleural effusion (MPE) and 48% non-malignant pleural effusion (BPE) groups. Serum CEA (cut-off, <3.5 ng/ml) and CA-125 (<35 U/mL) had the sensitivity of 76.7% and 80%, specificity 71.4% and 67.9%, positive predictive value 74.2% and 72.7%, and negative predictive value 74.1% and 76%, respectively. For pleural fluid (PF) biomarkers, PF CEA (at <5.3 ng/ml) and PF CA-125 (at <345.6 U/mL) had 83.3% and 90% sensitivity, 78.6% and 85.7% specificity, 80.6% and 87.1% positive predictive value, and 81.5% and 88.9% negative predictive value, respectively. The Area under Curve (AUC) from ROC analysis for pleural fluid CA-125 and CEA were 0.879 and 0.810. In terms of diagnostic accuracy, the diagnostic odds ratios of pleural fluid CA-125 and CEA test were 20.34 and 17.68, respectively. Considering the sensitivity, specificity, positive predictive value, negative predictive value, AUC value, and diagnostic utilization, pleural fluid CA-125, followed by pleural fluid CEA was the most effective indicator for identifying lung cancer associated malignant pleural effusion.
Keywords: malignant pleural effusion, pleural fluid CA-125 and CEA, serum CA-125 and CEA
- INTRODUCTION
Malignant pleural effusion (MPE) is a common phenomenon in lung cancer and other cancer related pleural disease [1]. However, a clear and fast diagnosis is often challenging. The presence of malignant pleural effusion is attributable to an advanced state of disease, and a correct diagnosis is crucial for further therapeutic decisions. Furthermore, malignant pleural effusion influences the prognosis of the patients. The median survival with malignant pleural effusion has been reported as 3–12 months, depending on the site of the primary neoplasm [2]. The initial diagnostic approaches include thoracocentesis with cytological and biochemical examination of the pleural fluid [3,4]. Although pleural fluid analysis by thoracentesis is the standard procedure and may be performed repeatedly, the sensitivity for the diagnosis of MPE is typically only 50–70% [5,6]. Thoracoscopy increases diagnostic accuracy and will exhibit a diagnosis in more than 90% of patients with pleural malignancy [7]. However, this procedure may not be available at all facilities and some patients with poor performance status and/or comorbidities may not be suitable for this intervention. Therefore, additional examinations may be needed. The evaluation of different tumor markers in the pleural fluid might be helpful in these decisions. Among all tumor markers, Carcinoembryonic antigen (CEA) and Cancer-Antigen (CA-125) are the most examined and frequently used markers for pleural fluid. Although there have been numerous scientific evaluations, their significance remains controversial due to varying results. The high-quality papers among those published have shown high specificity, however sensitivity largely varies. Furthermore, variable cut-off values have been reported. A meta-analysis by Shi and colleagues showed an overall sensitivity of 0.54 with a specificity of 0.94 [8]. Several authors reported higher sensitivity when combining different tumor markers [9,10], and other authors reported that CEA has the highest diagnostic value when comparing different tumor markers in the pleural fluid [11,12]. What all these studies have in common is that the analysis of tumor markers, and especially CEA, is recommended when MPE is suspected. Tumor markers had higher levels in malignant pleural effusion than in effusions due to non-malignant conditions. However, the overall composition, quantity of fluid and concentration of different molecules and proteins in the MPE largely varies among patients and cancer entities. Even in the same patient, recurring MPE might bring different results with every analysis. This might be a problem for the correct use of diagnostic tumor markers such as CEA in the pleural fluid. Up to now, there is no clear recommendation for a specific cut-off value, although there are several investigations with varying values ranging from 3 ng/ml to 50 ng/ml [13-15]. In 2004, Trape and colleagues reported promising results of simultaneous determination of tumor markers in pleural fluid and serum in a smaller cohort (22 patients with MPE) [16]. Korczynski and colleagues investigated CEA and other tumor markers and their ratio in 2009 in a similar small cohort of 36 patients with MPE, showing CEA as the most valuable tumor marker, especially when the ratio is calculated [17]. They determined the best cut-off for the ratio to be 0.83. In 2016, Tozzoli and colleagues evaluated 71 MPE (excluding mesothelioma) for CEA in pleural fluid and serum together with pleural cytology showing high sensitivity for non-small-cell lung cancer. Another publication from 2016 with a remarkable sample size of 130 patients investigated the differentiation of malignant and tuberculous pleural effusion by using CEA ratio [18]. In a recent publication, Zhai and colleagues presented the results of two Chinese cohorts with a total of 119 malignant pleural effusion patients. Area under the curve (AUC) for CEA measurements in pleural fluid was slightly higher than for a CEA ratio of 1.1 [19]. The performance of other tumor markers such as CA-125, CA 15-3, CA 19-9, NSE, SCC and CYFRA 21-1 was investigated in most of the previously mentioned papers. However, CA-125 and CEA were consistently the best performing parameter either as an isolated value in pleural fluid (or as a ratio, if investigated). The most common malignancy associated with malignant effusions is bronchial carcinoma, responsible for roughly 30% of cases, followed by lymphoma and breast cancer. These three conditions cause nearly 70% of all malignant effusions. A major challenge with effusion diagnosis is differentiating between effusions caused by malignant or non-malignant conditions. The presence of a malignant effusion indicates a poor prognosis with a median survival of about 4 months. Conversely, patients with non-malignant effusions often require additional investigations to identify the cause and may require immediate treatment if diagnosed with tuberculosis or pneumonia. The cytological analysis of pleural fluid method has 100% specificity, however its sensitivity ranges from 40% to 70% as malignant cells may be absent from the sample, incorrectly identified or sometimes overlooked. Analysis of tumor markers in pleural effusions has been considered as a less invasive alternative in comparison to core biopsy for differentiation of malignant from non-malignant effusions, especially in cases where cytological examination is not conclusive. Such tumor markers include Carcinoembryonic antigen (CEA) and Cancer antigen-125 (CA-125). The utility of these markers remains recommendable, with reported sensitivities ranging from 20% to 98%. Confounding issue is the fact that many studies do not take the origin of malignancy into consideration. Therefore, it is more useful to analyze the performance of tumor markers in pleural effusions caused by primary lung carcinoma. The purpose of this study is to measure pleural fluid CA-125 and CEA along with serum CA-125 and CEA and compare them to determine their usefulness in the diagnosis of malignant pleural effusion. This study focused on the diagnostic usefulness of pleural fluid CA-125 and CEA compared to serum CA-125 and CEA in malignant pleural effusion.
2. MATERIALS & METHOD
This study was done at Department of Respiratory Medicine, BSMMU, Dhaka. The Study Period was Twelve months from the date of IRB approval, and it was Cross-sectional observational study and Study Population comprises of patients with pleural effusion. Non-Probability sampling Method was used with Sample size of Fifty-eight (58) pleural effusion subjects (malignant and non-malignant)
Table 01: Explanation on the calculation of sample size in Sensitivity & Specificity studies
| Disease | ||||
| + | – | |||
| Test | + | a | b | |
| – | c | d | ||
| (a+c) | (b+d) | N | ||
The sample size that we want to calculate is “total sample size” N. What the study would like to determine are “Sensitivity” which is a/ (a+ c), and “Specificity” which is d/(b+d). Therefore, we need to calculate the sample size to acquire an appropriate precision for estimating “Sensitivity” and “Specificity”. By using usual single proportion sample size formula (1), we can calculate the sample size for (a+c), if we use ‘Sensitivity’ as P (∆ is precision). After we get (a+c), the total sample size can be obtained using Prevalence of the disease (using the formula 2). Similarly, we can calculate the sample size for (b+d), if we use Specificity as P in formula (1). After getting (b+d), the total sample size can be calculated by formula (3). The sample size was calculated by using the following formula:
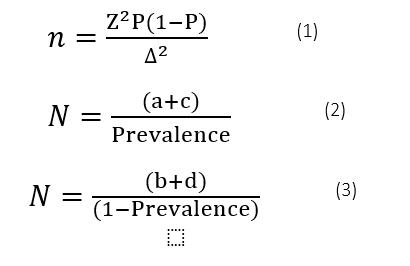
Where,
N = Estimated sample size
Z = 1.96 (in 95% CI) value of standard normal distribution
P = The sensitivity of CEA and CA-125 in malignant pleural effusion 82% and 86% respectively
Prevalence = 35%
∆ = marginal error (0.16)
So, n = (1.96)2x0.82 x (1-0.82)/ (0.16)2
= 0.56722/0.026
= 21.82
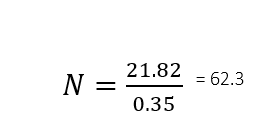
According to the above formula and keeping in mind sampling error, the final sample size was 62.3 (≈ 62). That is, 62 pleural effusion patients (both malignant and non-malignant) were initially considered as the final sample of this study. Data were collected in a semi-structured data collection sheet. The patients were enrolled according to selection criteria and then were explained properly about the purpose, procedure, potential physical and psychosocial risks, and right to refuse to participate. Then after obtaining informed written consent, a thorough history and physical examination was done. Then under all aseptic precautions, pleural fluid aspiration was done by sitting forward, leaning on a pillow over the table, with their arms folded in front of them. Skin, intercostal muscle, and parietal pleura was infiltrated with 10-20 ml (up to 3mg/kg) of 2% lidocaine. Then, a 14-gauge needle attached with a transfusion set was inserted into the pleural space and pleural fluid was drawn. Pleural fluid was then collected into multiple sterile test-tubes. After that, careful dressing was applied to the puncture site. Again, under all aseptic precautions, 5 ml of venous blood was drawn from the median antecubital vein of each participant in a disposable plastic syringe and was readily delivered into a clean tube which was kept in a standing position till clot and serum formation. Later, collected pleural fluid samples along with serum samples were sent for CEA and CA-125 estimation in the Biochemistry department of BSMMU. The samples were measured by chemiluminescence microparticle immunoassay in machine LIAISON XL Analyzer. The kits used were LIAISON CEA (REF 314311) for CEA estimation and LIAISON CA-125 II (REF 314211) for CA-125 estimation. Data collection tools were a semi-structured questionnaire containing items to elicit socio-demographic information and relevant information about physical illness. A checklist of investigation findings. Informed written consent form. All data were checked for completeness, correctness, and internal consistency to exclude missing or inconsistent data. Data were compiled and analyzed by using the SPSS-25 version. The continuous variables were expressed as mean and standard deviation. The categorical data were expressed as frequency and percentage distribution. An analysis of the receiver operator characteristic (ROC) curve was carried out to determine the area under the curve (AUC), the sensitivity, specificity, positive predictive value, and negative predictive value at an optimal cut-off value of pleural fluid and serum CA-125 and CEA levels in malignant pleural effusion. The positive likelihood ratio (LR+) and negative likelihood ratio (LR-) were used to define the diagnostic odds ratio.
- RESULTS & DISCUSSION
This was a cross-sectional observational study. An extensive literature search was done. The study was performed under the direct supervision of the guide and co-guide. The study population of this study was first evaluated by the investigator, then related investigations and pleural fluid aspiration was performed. Then pleural fluid CA-125 and CEA along with serum CA-125 and CEA were measured in those patients. Collected data was verified and cross-checked by the guide and co-guide. To ensure the quality of the study, we conducted a pilot study with one-third of the sample size, and after the results were satisfactory, we proceeded with further study. All information of patients was kept confidential under the responsibility of the principal investigator and collected specimens were used only for this study. Nobody other than the investigator’s regulatory authorities and the Ethical Review Committee had any access to such information. The patient’s identity was not disclosed while publishing the results.
Table 02: Frequency and percentage distribution of respondents’ age group
| Age group (in years) | Frequency | Percentage |
| Mean 56.5 (SD ±11.4) | ||
| 40 – 49 | 20 | 34.5 |
| 50 – 59 | 12 | 20.7 |
| 60 – 69 | 18 | 31.0 |
| 70 – 79 | 4 | 6.9 |
| 80 – 89 | 4 | 6.9 |
Table 02 shows the age distribution of the participants. The mean age of the 58 respondents was 56.5 (± 11.4) years old. Most of the respondents were from 40 to 49 years old age group, i.e., 34.5%, followed by the age group 60 – 69 years old (31%).
Table 03: Frequency and percentage distribution of respondents’ gender
| Gender | Frequency | Percentage |
| Male | 43 | 74.1 |
| Female | 15 | 25.9 |
Table 03 shows that nearly three-fourths of the respondents were male i.e., 74.1%. And 25.9% were female.
Table 04: Frequency and percentage distribution of respondents’ smoking status
| Smoking status | Frequency | Percentage |
| No | 25 | 43.1 |
| Yes | 33 | 56.9 |
Table 04 shows that more than half of the respondents were smokers (57%). And, 43% of respondents never smoked in their lifetime. And the average pack year was 30 pack year.
Table 05: Frequency and percentage distribution of clinical characteristics of the respondents
| Clinical characteristics | Frequency | Percentage | |
| Fever | |||
| No | 14 | 24.1 | |
| Yes | 44 | 75.9 | |
| Mean duration (in days) (±SD) | 62.3 (± 40.1) | ||
| Cough | |||
| No | 4 | 6.9 | |
| Yes | 54 | 93.1 | |
| Mean duration (in days) (±SD) | 105.4 (± 95.2) | ||
| Shortness of breath | |||
| No | 26 | 44.4 | |
| Yes | 32 | 55.2 | |
| Mean duration (in days) (±SD) | 113.1 (±121.5) | ||
| Chest pain | |||
| No | 33 | 56.9 | |
| Yes | 25 | 43.1 | |
| Mean duration (in days) (±SD) | 61.9 (± 42.1) | ||
| Hemoptysis | |||
| No | 54 | 93.1 | |
| Yes | 4 | 6.9 | |
| Mean duration (in days) (±SD) | 14 | ||
| Weight loss | |||
| No | 18 | 31.0 | |
| Yes | 40 | 69.0 | |
| Mean duration (in days) (±SD) | 6 kg in 40 days | ||
| Anorexia | |||
| No | 19 | 32.8 | |
| Yes | 39 | 67.2 | |
| Mean duration (in days) (±SD) | 65.2 (± 59.1) | ||
Table 05 shows the clinical characteristics (fever, cough, shortness of breath, chest pain, hemoptysis, weight loss, and anorexia) of the respondents. More than three-fourths of the respondents (75.9%) had fever at the time of survey, and the mean duration of fever was 62.3 days. Nine out of 10 respondents were suffering from cough (93.1%) and the mean duration of cough was 105.4 days. About 55% patients were experiencing shortness of breath and the mean duration of shortness of breath was 113 days. 43% of respondents had chest pain for an average of 61.9 days. Only 7% respondents had hemoptysis. Nearly seven out of 10 respondents (69%) experienced weight loss, and on average, they lost 6 kg in 40 days. And, 67% of respondents had anorexia, and the mean duration was 65.2 days.
Table 06: Frequency and percentage distribution of respondents’ previous clinical history
| Clinical history | Frequency | Percentage |
| Hypertension | ||
| No | 39 | 67.2 |
| Yes | 19 | 32.8 |
| Diabetes Mellitus | ||
| No | 38 | 65.5 |
| Yes | 20 | 34.5 |
Table 06 represents the clinical history of patients. In this study, as clinical history, we have considered hypertension and diabetes mellitus. Three out of 10 respondents had hypertension. Nearly 35% of patients had diabetes mellitus.
Table 07: Frequency and percentage distribution of respondents’ physical status
| Physical findings | Frequency | Percentage |
| Body Mass Index (BMI) (kg/m2) | ||
| Underweight | 2 | 6.7 |
| Normal | 23 | 76.7 |
| Overweight | 5 | 16.7 |
| Anemia | ||
| Absent | 39 | 67.2 |
| Present | 19 | 32.8 |
| Clubbing | ||
| Absent | 43 | 74.1 |
| Present | 15 | 25.9 |
| Lymph node | ||
| Enlarged | 11 | 19.0 |
| Not enlarged | 47 | 81.0 |
Table 07 shows that one-third of the patients had anemia (32.8%), and a quarter of respondents had clubbing (25.9%). Again about 77% of respondents had normal BMI. Only 7% of respondents were underweight. And the lymph node of only 19% were enlarged 81%. None of the patients had jaundice or oedema.
Table 08: Sex-specific mean distribution of the clinical variables of the respondents
| Clinical variables (mean) | Male | Female | Reference |
| Pulse (per min) | 82.3 | 80.9 | 60 – 100 |
| Blood Pressure | |||
| Systolic | 107.9 | 107.3 | 120 |
| Diastolic | 71.2 | 70.7 | 80 |
| Body temperature (F) | 98.4 | 98.5 | 98.6 |
| Respiratory rate (per min) | 18.4 | 18.1 | 12 – 16 |
Table 08 displays the sex specific mean distribution of respondents’ clinical outcomes. For males, the mean systolic/diastolic blood pressure (BP) was 107.9/71.2 mm of Hg. And for females, the mean systolic/diastolic BP was 107.3/70.7 mm of Hg. Considering the references of BP, both males and females had low BP. On average, the body temperature was around 98.5 F in both sexes. In both sexes, the mean respiratory rate was higher, compared to the reference range, i.e., around 18.4. But the pulse/min was normal in both sexes, i.e., 82.3 and 80.9 per minute, for male and female, respectively.
Table 09: Sex-specific mean distribution of the laboratory variables of the respondents
| Laboratory variables (mean) | Male | Female | Reference |
| Complete blood count | |||
| Hb (grams/dL) | 11.6 | 10.9 | Male: 13.2 – 16.6
Female: 11.6 – 15 |
| ESR (mm in 1st hr) | 59.5 | 52.7 | Male: <20
Female: <30 |
| WBC (cells/m3) | 9468.8 | 10219.3 | 4000 – 11000 |
| C-Reactive Protein (mg/L) | 10.4 | 11.8 | <5 |
| RBS (Random Blood Sugar) (mmol/L) | 9.0 | 8.7 | <7.8 |
| S. Creatinine (mg/dL) | 1.02 | 1.04 | 0.59 – 1.04 |
| ALT (Alanine Transaminase) (U/L) | 41.40 | 36.6 | 7 – 55 |
While investigating the complete blood count (CBC), the hemoglobin (Hb) count was on average 11.6 grams/dL (male) and 10.9 grams/dL (female); ESR count was higher, i.e., 59.5 mm/hr. (male) and 52.7 mm/hr. (female); and white blood cell (WBC) count was normal for both males (9468.8 cells/mcl) and females (10219.3 cells/mcl). The C-Reactive Protein was also higher than the normal range in both sexes, i.e., 10.4 mg/L in males, and 11.8 mg/L for females. The RBS was observed slightly higher, i.e., 9 mmol/L in male and 8.7 mmol/L in female. The S. Creatinine and ALT outcome were within normal range in both sexes.
Table 10: Frequency and percentage distribution of malignant and non-malignant pleural effusion group
| CT Guided FNAC | Frequency | Percentage | Percentage** |
| Malignant (n = 30) | |||
| Adenocarcinoma | 13 | 22.4 | 43.3 |
| Squamous cell carcinoma | 7 | 12.1 | 23.4 |
| Small cell carcinoma | 10 | 17.2 | 33.3 |
| Non-malignant (n = 28) | |||
| Granulomatous inflammation (Tuberculosis) | 15 | 25.9 | 53.6 |
| Inflammatory
lesion (Pneumonia) |
13 | 22.4 | 46.4 |
Table 10 shows the frequency and percentage distribution of malignant and non-malignant pleural effusion groups indicating the lung cancer type vs. no lung-cancer type. Among the malignant pleural effusion (MPE) patients, 43% of respondents had adenocarcinoma, and one-third had small cell carcinoma. On the other hand, among the no lung-cancer type patients (non-malignant), granulomatous inflammation (tuberculous) was found in 53.6% patients, whereas inflammatory lesion (parapneumonic) was found in 46.4% respondents. In Table we showed the percentage distribution of malignant and non-malignant pleural effusion groups. Now, in the following table, we are going to investigate how many yielded positive vs negative results (in percentage) when only the malignant patients (n = 30) are tested by serum and pleural fluid CEA and CA-125 tumor markers.
Table 11: Estimation (percentage) of pleural fluid and serum CEA and CA-125 biomarkers among the malignant pleural effusion (MPE) groups
| Outcome | Serum CEA | Serum CA-125 | Pleural fluid CEA | Pleural fluid CA-125 |
| Positive (%) | 76.7 | 80 | 83.3 | 90 |
| Negative (%) | 23.3 | 20 | 16.7 | 10 |
Table 11 shows the percentage estimation of serum CEA and CA-125 vs. pleural fluid CEA and CA-125 among only the MPE groups, i.e. among 30 patients. In general, pleural fluid biomarkers provided better results identifying MPE groups than serum ones. Pleural fluid CA-125 showed best estimation in this investigation, i.e. 90%, followed by pleural fluid CEA (83.3%), and serum CA-125 (80%).
Table 12: Sensitivity, Specificity, positive predictive value, negative predictive value of pleural fluid CA-125 and CEA as well as serum CA-125 and CEA
| Tumor markers | Sensitivity | Specificity | Positive predictive value | Negative predictive value |
| Serum CEA1 | 76.7% | 71.4% | 74.2% | 74.1% |
| Pleural fluid CEA2 | 83.3% | 78.6% | 80.6% | 81.5% |
| Serum CA-1253 | 80.0% | 67.9% | 72.7% | 76.0% |
| Pleural fluid CA-1254 | 90.0% | 85.7% | 87.1% | 88.9% |
Table 12 shows the comparison of sensitivity, specificity, positive predictive value, and negative predictive value of both serum and pleural fluid CEA and CA-125 markers. In terms of serum CEA marker, serum CEA had 76.7% sensitivity, 71.4% specificity, 74.2% positive predictive value, and 74.1% negative predictive value, when the cut-off was for Serum CEA<3.5 ng/ml. For pleural fluid CEA biomarker, it had 83.3% sensitivity, 78.6% specificity, 80.6% positive predictive value, and 81.5% negative predictive value, when the cut-off was Pleural fluid CEA<5.3 ng/ml. On the other hand, for Serum CA-125, the sensitivity was 80%, specifically 67.9%, positive predictive value was 72.7%, and negative predictive value was 76%, while the cut-off was Serum CA-125<35 U/ml. And, in terms of pleural fluid CA-125, it showed the highest efficacy, ie. 90% sensitivity, 85.7% specificity, 87.1% positive predictive value, and 88.9% negative predictive value, when the cut off was Pleural fluid CA-125<345.6 U/ml.
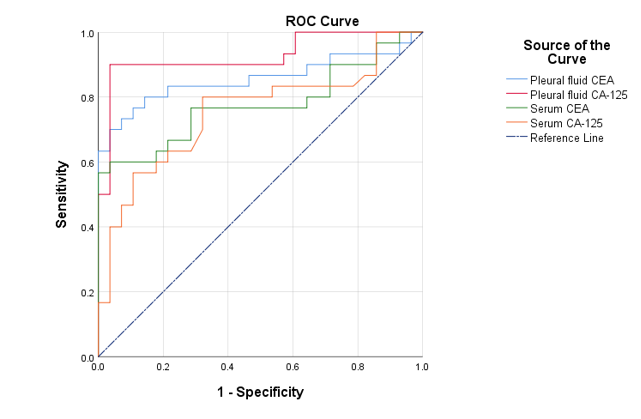
Figure 01: ROC curve of serum and pleural fluid CEA and CA-125 biomarkers
The Receiver Operator Characteristic (ROC) curve is an evaluation metric for binary classification problems. It is a probability curve that plots the True Positive Rate (TPR) against False Positive Rate (FPR) at various threshold values and essentially separates the ‘signal’ from the ‘noise’. The ROC curves of PF CEA, serum CEA, PF CA-125, and serum CA-125 to identify the most effective biomarkers are shown in Fig. 8.1. As a result, PF CA-125 was the most discriminative biomarker for lung cancer-associated MPE. The diagnostic performance of tumor biomarkers for lung cancer-associated MPE in the test set. The test set consisted of 58 patients (30 patients with malignant, and 28 patients without lung cancer). The Area under the Curve (AUC) is the measure of the ability of a classifier to distinguish between classes and is used as a summary of the ROC curve. ROC analysis was performed to determine the cut-off levels of sensitivity and specificity of each tumor biomarker.
Table 13: Area under curve (AUC) from ROC curve of serum and pleural CEA and CA-125
| Tumor markers | Area under curve | Standard error | Significance | At 95% confidence interval | |
| Lower bound | Upper bound | ||||
| Serum CA125 | 0.734 | 0.066 | 0.001 | 0.607 | 0.871 |
| Serum CEA | 0.740 | 0.067 | 0.000 | 0.609 | 0.872 |
| Pleural fluid CA125 | 0.879 | 0.037 | 0.000 | 0.780 | 0.977 |
| Pleural fluid CEA | 0.810 | 0.054 | 0.000 | 0.692 | 0.927 |
The effective tumor biomarkers were defined as biomarkers with an AUC value greater than 0.7. AUC ranges in value from 0 to 1. A model whose predictions are 100% wrong has an AUC of 0.0; one whose predictions are 100% correct has an AUC of 1.0. Hence, table shows that all the biomarkers showed effective estimation in this study. Specifically, PF CA-125 and CEA showed the most distinguished cut-off as effective biomarkers, i.e., the area under curves were AUC of PF CA-125 = 0.879 (95% CI: 0.78 – 0.98; Significant: 0.000), and AUC of PF CEA = 0.810 (95% CI: 0.69 – 0.92; Significance: 0.000). In medical testing with binary classification, the diagnostic odds ratio (DOR) is a measure of the effectiveness or accuracy of a diagnostic test. It is defined as the ratio of the odds of the test being positive if the subject has a disease relative to the odds of the test being negative if the subject does not have the disease. The rationale for the diagnostic odds ratio is that it is a single indicator of test performance, but which is independent of prevalence (unlike accuracy) and is presented as an odds ratio, which is familiar to medical practitioners.
Table 14: Diagnostic odds ratio of the four tumor markers used in this study
| Tumor markers | Positive likelihood ratio (LR+) | Negative likelihood ratio (LR-) | Diagnostic odds ratio |
| Serum CA-125 | 2.49 | 0.29 | 8.58 |
| Serum CEA | 2.68 | 0.33 | 8.12 |
| Pleural fluid CA-125 | 5.29 | 0.29 | 20.34 |
| Pleural fluid CEA | 3.89 | 0.22 | 17.68 |
The diagnostic odds ratio ranges from zero to infinity, although for useful tests it is greater than one, and higher diagnostic odds ratios are indicative of better test performance. Diagnostic odds ratios less than one indicate that the test can be improved by simply inverting the outcome of the test – the test is in the wrong direction, while a diagnostic odds ratio of exactly one means that the test is equally likely to predict a positive outcome whatever the true condition – the test gives no information. Here, in Table 14, pleural fluid CA 125, followed by CEA, with a diagnostic odds ratio of 20.34 and 17.68, respectively, can be considered as very good tests. This study estimated the value of pleural fluid CA-125 and CEA along with serum CA-125 and CEA in all malignant and non-malignant subjects and then compared their diagnostic usefulness in malignant pleural effusion. Additionally, the sensitivity, specificity, positive predictive value, negative predictive value of pleural fluid CA-125 and CEA as well as serum CA-125 and CEA in malignant pleural effusion were investigated using the cut-off values from ROC curves. And the diagnostic algorithms of pleural fluid CA-125 and CEA were also estimated. In this study, all the respondents were above 40 years, predominantly male, and most had normal BMI. From the total study population of 58, 30 respondents were MPE cases, and 28 were non-malignant cases. Those patients were diagnosed with CT guided FNAC, which has been considered as Gold Standard test. Among the used biomarkers, pleural fluid CA-125 was the most effective biomarker to identify lung cancer-associated MPE at the cut-off value of 345.6 U/ml (sensitivity at 90%, specificity at 85.7%), followed by pleural fluid CEA at the cut-off value of 5.3 ng/ml (sensitivity 83.3%, specificity 67.9%). Furthermore, pleural fluid CA-125 at 345.6 U/ml showed the highest sensitivity (90%), specificity (85.7%), and accuracy, positive and negative predictive values for lung cancer-associated MPE when compared with other tumor markers. Therefore, it was concluded that pleural fluid CA-125 at the cut-off level of 345.6 U/ml may be the most effective indicator for identifying lung cancer-associated MPE. Pleural effusion is a common and important complication, caused by many diseases, especially malignant tumors [20,21]. It is important to understand the etiology of pleural effusion, especially to distinguish between benign and malignant pleural effusion [22]. Thoracentesis, as well as cytology and histology, is a preliminary diagnostic method of pleural effusion [23]. However, these common methods sometime can produce false negatives. Therefore, auxiliary indicators are needed to improve the accuracy of diagnosis. In recent years, tumor biomarkers have been found to be important in the differential diagnosis of cancer-associated effusion [24]. Among these parameters, CEA, and CA-125 were found to have a more significant diagnostic value than others [25]. Some studies have shown that the tumor biomarkers in serum had good diagnostic significance, while other studies have shown that tumor biomarkers in pleural fluid rather than in serum had better identification significance [26]. However, it was unclear which biomarkers were the most effective indicator in identifying MPE. In this study, the pleural fluid value, and the serum value of different tumor biomarkers were compared to finding the best diagnostic indicator. The study demonstrated that CA-125 and CEA, especially in pleural fluid, had better auxiliary diagnostic significance than other biomarkers in defining lung cancer associated with MPE. CA-125 is not a specific tumor marker and is synthesized by normal and malignant cells of different origin (mainly in tissues derived from the mullerian epithelia) in similar proportion. Abnormal CA-125 levels may be found in fluids of different origins (ascites, pleura, pericardium, amniotic fluid, cyst fluid, bronchoalveolar fluid, etc.) and in serum from patients with these fluids. Differences in serum CA-125 found in malignant or non-malignant diseases may be related to the number of cells that synthesize the marker, and are highly dependent on the access to serum, where the marker is normally determined. Moreover, studies have found that CA-125 is a very good tumor marker in ovarian and lung cancer [27]. The sensitivity of CA-125 in ovarian cancer is related to stage (40-95%), histological type (lower levels in mucinous adenocarcinoma), and the marker is useful in the early detection of recurrence (sensitivity 80%) and in therapy monitoring. Its sensitivity in lung cancer is lower than in ovarian cancer, 39% in locoregional malignancies and 69% in metastatic disease, but clearly related to stage and histology (mainly in adenocarcinomas and large cell lung cancer) and it is useful in prognosis and disease monitoring [28,29]. Though in most cases pleural fluid CEA showed effective diagnostic estimation identifying tumors, pleural effusion with increased CA-125 levels may occur in pelvic conditions other than ovarian carcinoma [30]. These include Meigs’ syndrome (secondary to ovarian fibroma) and pseudo-Meigs’ syndrome (secondary to other non-malignant pelvic tumors) [31]. Removal of tumors is associated with a rapid decline in tumor markers. Increased CA-125 levels may occur with non-gynecological malignancy such as lung cancer (69% with metastatic disease), mediastinal teratoma, and non-Hodgkin’s lymphoma [32]. Tuberculosis is another cause of massive pleural effusion associated with increased levels of CA-125.7 Increased CA-125 levels may occur in connective tissue diseases, chronic constrictive pericarditis, and in patients on hemodialysis with pleural effusion [33,34]. In a study to evaluate the level of CA-125 in serum of patients with history of previous surgery, heart failure, pulmonary disease, cirrhosis and intrabdominal disease, Mirales et al. have reported increased CA-125 levels (>35 IU/ml) [35]. Other studies have reported high serum CA-125 levels in tuberculosis, mainly in extrapulmonary locations with abdominal involvement [36,37]. Since this study showed that the amount of CA-125 in pleural fluid of malignant patients was found to be significantly higher than in tuberculous pleural fluid, this is in agreement with the same results of Shervin et al. who stated that estimating pleural fluid CA-125 in patients with an unidentified and unclassical history is very useful. This is because the chronic nature of this disease whether malignant or tuberculosis makes it very difficult to distinguish these two from each other requiring costly tests which may be avoided by using this method [38,39]. Also, [31] compared the level of pleural fluid CA-125 in 51 patients affected by pleural effusion secondary to malignancy and 38 patients affected by non-malignant effusion in a study to examine the histological distribution of CA-125 in patients affected by pleural effusion. They determined, as in agreement with the present study, that the amount of CA-125 in malignant effusion is remarkably higher than in the other cases in which effusion is due to other causes. They confirmed that CA-125 in pleural effusion is produced by both malignant cells and active mesothelial cells [40]. From the examinations, all the tumor biomarkers were with an AUC greater than 0.7, but for pleural fluid CA-125, the AUC was more than 0.8. These findings were similar to the study of [41]. Their study confirmed that while comparing with other tumor biomarkers, pleural fluid CA-125 demonstrated the highest diagnosis rate, and the highest sensitivity, specificity, and accuracy, positive and negative predictive values for lung cancer-associated malignant pleural effusion, which is similar to our study. Therefore, both the CEA and CA-125 in pleural fluid were the best indicator for identifying lung cancer-associated malignant pleural effusion. Additionally, for diagnostic application, pleural fluid CA-125 and CEA both showed significant odds ratio which indicated effective usage of these biomarkers in terms of lung cancer patients. Hirose and his colleagues reported a case of tuberculous effusion in which the level of serum CA-125 was 1150 units per ml [42]. Their study showed that pleural cells were covered with antibodies against CA-125 and that CA-125 originated from pleural cells. They then concluded that malignant morphologic changes in the cells are not necessary for secretion of CA-125. The amount of CA-125 in both infection (TB) and malignant cases increases and can be a useful diagnostic guide [43].
- CONCLUSIONS
The study consisted of 58 patients with pleural effusion (both malignant and non-malignant). The diagnosis of pleural effusion was based on clinical, radiological, and histological examinations. Then the sensitivity, specificity, positive predictive value, negative predictive value, and diagnostic odds ratio along with ROC curve of serum and pleural fluid CA-125 and CEA were investigated for the diagnosis of malignant pleural effusion. The mean age of the 58 respondents was 56.5 (SD ±11.4) years old, and 74.1% respondents were male. There were 52% malignant pleural effusion (MPE) and 48% non-malignant pleural effusion (BPE) groups. Serum CEA (cut-off, <3.5 ng/ml) and CA-125 (<35 U/mL) had the sensitivity of 76.7% and 80%, specifically 71.4% and 67.9%, positive predictive value 74.2% and 72.7%, and negative predictive value 74.1% and 76%, respectively. For pleural fluid (PF) biomarkers, PF CEA (at <5.3 ng/ml) and PF CA-125 (at <345.6 U/mL) had 83.3% and 90% sensitivity, 78.6% and 85.7% specificity, 80.6% and 87.1% positive predictive value, and 81.5% and 88.9% negative predictive value, respectively. The Area under Curve (AUC) from ROC analysis for pleural fluid CA-125 and CEA were 0.879 and 0.810. In terms of diagnostic accuracy, the diagnostic odds ratios of pleural fluid CA-125 and CEA test were 20.34 and 17.68, respectively. Considering the sensitivity, specificity, positive predictive value, negative predictive value, AUC value, and diagnostic utilization, pleural fluid CA-125, followed by pleural fluid CEA was the most effective indicator for identifying lung cancer associated malignant pleural effusion. In conclusion, this study compared the sensitivity, specificity, positive predictive value, and negative predictive value of pleural fluid CA-125 and CEA as well as serum CA-125 and CEA in the diagnosis of malignant pleural effusion. In terms of sensitivity and specificity, pleural fluid CA-125, followed by pleural fluid CEA was the most effective indicator for identifying lung cancer-associated malignant pleural effusion in comparison to serum CA-125 and CEA level. On the other hand, the ROC, AUC, and the diagnostic utilization, also indicate that pleural fluid CA-125, followed by pleural fluid CEA showed significant odds ratio in comparison to serum CA-125 and CEA, which indicated effective usage of these biomarkers for lung cancer patients.
REFERENCES
- Antonangelo, L., Sales, R. K., Corá, A. P., Acencio, M. M. P., Teixeira, L. R., & Vargas, F. S. (2015). Pleural fluid tumour markers in malignant pleural effusion with inconclusive cytologic results. Current Oncology, 22(5), e336–e341.
- Amrit Raj Subedi (2024). Combined Pleural Fluid Cholesterol and Total Protein in Differentiation of Exudates and Transudates in Cases Presenting in Tribhuvan University Teaching Hospital. Dinkum Journal of Medical Innovations, 3(09):630-644.
- Edmondstone, W. (1990). Investigation of pleural effusion: Comparison betweenfibreoptic thoracoscopy, needle biopsy and cytology. Respiratory Medicine, 84(1), 23–26.
- El Hoshy, M. S., Abdallah, A. A., & Abd Elhamid, S. M. (2017). Comparison of the diagnostic utility of ADA and CA125 in tuberculous effusion. Egyptian Journal of Chest Diseases and Tuberculosis, 66(2), 299–305.
- Feller-Kopman, D. J., Reddy, C. B., DeCamp, M. M., Diekemper, R. L., Gould, M. K., Henry, T., Iyer, N. P., Lee, Y. G., Lewis, S. Z., & Maskell, N. A. (2018). Management of malignant pleural effusions. An official ATS/STS/STR clinical practice guideline. American Journal of Respiratory and Critical Care Medicine, 198(7), 839–849.
- Feller-Kopman, D., & Light, R. (2018). Pleural disease. New England Journal of Medicine, 378(8), 740–751.
- Fenton, K. N., & Richardson, J. D. (1995). Diagnosis and management of malignant pleural effusions. The American Journal of Surgery, 170(1), 69–74.
- Ferrer, J., Villarino, M. A., Encabo, G., Felip, E., Bermejo, B., Vilà, S., & Orriols, R. (1999). Diagnostic utility of CYFRA 21-1, carcinoembryonic antigen, CA 125, neuron specific enolase, and squamous cell antigen level determinations in the serum and pleural fluid of patients with pleural effusions. Cancer, 86(8), 1488–1495.
- Noor Alam Ansari, Sanjay Prasad Sah, Susanta Kumar Paul, Pratik Wagley, Shamim Ahmed & Mohammed Atiqur Rahman (2025). Assessment of Vitamin D 25(OH)D Status in Patients with Tuberculous Pleural Effusion in a Tertiary Care Hospital: A Cross-Sectional Study. Dinkum Journal of Medical Innovations, 4(01):15-28.
- Hackbarth, J. S., Murata, K., Reilly, W. M., & Algeciras-Schimnich, A. (2010). Performance of CEA and CA19-9 in identifying pleural effusions caused by specific malignancies. Clinical Biochemistry, 43(13–14), 1051–1055.
- Heffner, J. E. (2010). Management of the patient with a malignant pleural effusion. 31(06), 723–733.
- Hirose, T., Ohta, S., Sato, I., Matsuda, M., Arai, T., Katsura, T., Fukaura, A., Nakajima, H., & Adachi, M. (1997). Tuberculous pleuro-peritonitis showing increased levels of CA125. The Japanese Journal of Thoracic Diseases, 35(2), 196–200.
- Hussain, S. F., Grayez, J., Grigorian, A., & Green, J. T. (2004). Massive pleural effusion and marked increase of CA-125. Postgraduate Medical Journal, 80(943), 300–301.
- Korczynski, P., Krenke, R., Safianowska, A., Gorska, K., Abou Chaz, M. B., Maskey-Warzechowska, M., Kondracka, A., Nasilowski, J., & Chazan, R. (2009). Diagnostic utility of pleural fluid and serum markers in differentiation between malignant and non-malignant pleural effusions. European Journal of Medical Research, 14 Suppl 4, 128–133.
- Sharif Masuma Ismat, Chowdhury Shamima Sultana, Maksuda Begum & Latifa Akhter (2025). Efficacy of FNAC in the Diagnosis of Advanced Ovarian Malignancy. Dinkum Journal of Medical Innovations, 4(05):230-244.
- Li, H., Shen, K., Lang, J., Wu, M., Huang, H., & Pan, L. (2003). Benign ovarian tumor with ascites and high serum levels of CA125: Report of 3 cases. Zhonghua Fu Chan Ke Za Zhi, 38(3), 147–149.
- Liang, Q., Shi, H., Qin, X., Liang, X., Jiang, J., & Yang, H. (2008). Diagnostic accuracy of tumour markers for malignant pleural effusion: A meta-analysis. Thorax, 63(1), 35–41.
- Lopez Rodriguez, R., & Lado Lado, F. (2006). CA-125, adenosine deaminase, and PCR for Mycobacterium tuberculosis in the diagnosis of peritoneal tuberculosis. Scandinavian Journal of Infectious Diseases, 38(8), 749–750.
- Mansour, M., Linden, E. R., Colby, S., Posner, G., & Marsh Jr, F. (1997). Elevation of carcinoembryonic antigen and CA-125 in a patient with multivisceral tuberculosis. Journal of the National Medical Association, 89(2), 142.
- Maskell, N., Gleeson, F., & Davies, R. (2003). Standard pleural biopsy versus CT-guided cutting-needle biopsy for diagnosis of malignant disease in pleural effusions: A randomised controlled trial. The Lancet, 361(9366), 1326–1330.
- Menard, O., Dousset, B., Jacob, C., & Martinet, Y. (1993). Improvement of the diagnosis of the cause of pleural effusion in patients with lung cancer by simultaneous quantification of carcinoembryonic antigen (CEA) and neuron-specific enolase (NSE) pleural levels. European Journal of Cancer, 29(13), 1806–1809.
- Miralles, C., Orea, M., Espana, P., Provencio, M., Sanchez, A., Cantos, B., Cubedo, R., Carcereny, E., Bonilla, F., & Gea, T. (2003). Cancer antigen 125 associated with multiple benign and malignant pathologies. Annals of Surgical Oncology, 10(2), 150–154.
- Molina, R., Filella, X., Jo, J., Agusti, C., & Ballesta, A. M. (1998). CA 125 in biological fluids. The International Journal of Biological Markers, 13(4), 224–230.
- Rajesh Niraula & Saroja Poudel (2024). Efficiency of CT & MRI in Diagnosis of Cholangiocarcinoma and Its Histopathological Correlation. Dinkum Journal of Medical Innovations, 3(05):401-415.
- Nguyen, A. H., Miller, E. J., Wichman, C. S., Berim, I. G., & Agrawal, D. K. (2015). Diagnostic value of tumor antigens in malignant pleural effusion: A meta-analysis. Translational Research, 166(5), 432–439.
- Paşaoğlu, G., Zamani, A., Can, G., & İmecik, O. (2007). Diagnostic Value Of CEA, CA-19-9, CA 125 And CA 15-3 Levels In Malignant Pleural Fluids. Electronic Journal of General Medicine, 4(4), 165–171.
- Porcel, J. M. (2018). Biomarkers in the diagnosis of pleural diseases: A 2018 update. Therapeutic Advances in Respiratory Disease, 12, 1753466618808660.
- Porcel, J. M., Esquerda, A., Vives, M., & Bielsa, S. (2014). Etiology of pleural effusions: Analysis of more than 3,000 consecutive thoracenteses. Archivos de Bronconeumología (English Edition), 50(5), 161–165.
- Porcel, J. M., Vives, M., Esquerda, A., Salud, A., Pérez, B., & Rodríguez-Panadero, F. (2004). Use of a panel of tumor markers (carcinoembryonic antigen, cancer antigen 125, carbohydrate antigen 15–3, and cytokeratin 19 fragments) in pleural fluid for the differential diagnosis of benign and malignant effusions. Chest, 126(6), 1757–1763.
- Radjenovic-Petkovic, T., Pejcic, T., Nastasijevic-Borovac, D., Rancic, M., Radojkovic, D., Radojkovic, M., & Djordjevic, I. (2009). Diagnostic value of CEA in pleural fluid for differential diagnosis of benign and malign pleural effusion. Med Arh, 63(3), 141–142.
- Rahemi, Z., Javadi, A., Kazeminejad, B., Ebrahimi, A., Vosough, H., Taghavi, A., & Dabiri, S. (2021). Diagnostic Utility of Combined CEA, CA15-3 and CA125 Biomarkers and Cytomorphology in Suspicious and Malignant Serosal Fluid. Iranian Journal of Pathology, 16(3), 248–255.
- Sharma, S. K., Bhat, S., Chandel, V., Sharma, M., Sharma, P., Gupta, S., Sharma, S., & Bhat, A. A. (2015). Diagnostic utility of serum and pleural fluid carcinoembryonic antigen, and cytokeratin 19 fragments in patients with effusion from nonsmall cell lung cancer. Journal of Carcinogenesis, 14.
- SHI, H., LIANG, Q., Jiang, J., QIN, X., & YANG, H. (2008). Diagnostic value of carcinoembryonic antigen in malignant pleural effusion: A meta‐analysis. Respirology, 13(4), 518–527.
- Shokouhi, S., Abadi, M. S., & Gachkar, L. (2005). Pleural fluid CA-125 in patients with pleural effusion. TANAFFOS (Respiration), 4(4 (autumn)), 23–27.
- Sthaneshwar, P., Yap, S. F., & Jayaram, G. (2002). The diagnostic usefulness of tumour markers CEA and CA-125 in pleural effusion. The Malaysian Journal of Pathology, 24(1), 53–58.
- Thakur, V., Mukherjee, U., & Kumar, K. (2001). Elevated serum cancer antigen 125 levels in advanced abdominal tuberculosis. Medical Oncology, 18(4), 289–291.
- Topolcan, O., Holubec, L., Polivkova, V., Svobodova, S., Pesek, M., Treska, V., Safranek, J., Hajek, T., Bartunek, L., & Rousarova, M. (2007). Tumor markers in pleural effusions. Anticancer Research, 27(4A), 1921–1924.
- Trapé, J., Molina, R., & Sant, F. (2004). Clinical evaluation of the simultaneous determination of tumor markers in fluid and serum and their ratio in the differential diagnosis of serous effusions. Tumour Biology: The Journal of the International Society for Oncodevelopmental Biology and Medicine, 25(5–6), 276–281.
- Villena, V., López‐Encuentra, A., Echave‐Sustaeta, J., Martín‐Escribano, P., Ortuño‐de‐Solo, B., & Estenoz‐Alfaro, J. (1996). Diagnostic value of CA 72‐4, carcinoembryonic antigen, CA 15‐3, and CA 19‐9 assay in pleural fluid: A study of 207 patients. Cancer: Interdisciplinary International Journal of the American Cancer Society, 78(4), 736–740.
- Wani, A. M., & Akhtar, M. (2008). CA-125: A marker for diagnosis and follow-up of pleuroperitoneal and lymph node tuberculosis. Annals of Saudi Medicine, 28(2), 142–143.
- Yang, Y., Liu, Y.-L., & Shi, H.-Z. (2017). Diagnostic Accuracy of Combinations of Tumor Markers for Malignant Pleural Effusion: An Updated Meta-Analysis. Respiration; International Review of Thoracic Diseases, 94(1), 62–69.
- Žentiņa, D., Stukěna, I., Grînberga, S., Krams, A., & Lejnieks, A. (2016). Diagnostic value of tumour markers Ca-125 and CEA in the diagnostics of malignant pleural fluids. Proceedings of the Latvian Academy of Sciences, Section B: Natural, Exact, and Applied Sciences.
- Zhai, K., Wang, W., Wang, Y., Liu, J.-Y., Zhou, Q., & Shi, H.-Z. (2017). Diagnostic accuracy of tumor markers for malignant pleural effusion: A derivation and validation study. Journal of Thoracic Disease, 9(12), 5220–5229.
Publication History
Submitted: October 25, 2025
Accepted: November 08, 2025
Published: November 30, 2025
Identification
D-0548
DOI
https://doi.org/10.71017/djmi.4.11.d-0548
Citation
Sanjay Prasad Sah, Noor Alam Ansari, Mohammed Atiqur Rahman, Shamim Ahmed, Rajashish Chakrabortty & Palash Debnath (2025). Diagnostic Usefulness of Pleural Fluid CA-125 and CEA Compared to Serum CA-125 and CEA in Malignant Pleural Effusion. Dinkum Journal of Medical Innovations, 4(11):755-769.
Copyright
© 2025 The Author(s).