

Publication History
Submitted: October 27, 2025
Accepted: November 22, 2025
Published: December 31, 2025
Identification
D-0558
DOI
https://doi.org/10.71017/djmi.4.12.d-0558
Citation
Md. Abdul Kader & Mohammad Tanvir Islam (2025). Identification of Potential Biomarkers to Differentiate Type 1 Myocardial Infarction in Diseases with Elevated Troponin Levels . Dinkum Journal of Medical Innovations, 4(12):855-863.
Copyright
© 2025 The Author(s).

855-863
Identification of Potential Biomarkers to Differentiate Type 1 Myocardial Infarction in Diseases with Elevated Troponin LevelsOriginal Article
Md. Abdul Kader 1*, Mohammad Tanvir Islam 2
- Department of Internal Medicine, Bangladesh Medical University, Dhaka, Bangladesh.
- Department of Internal Medicine, Bangladesh Medical University, Dhaka, Bangladesh.
* Correspondence: kaderjsf574@gmail.com
Abstract: Differentiating Type 1 Myocardial Infarction (T1MI) from other conditions associated with elevated cardiac troponin remains a major diagnostic challenge. While troponin is highly sensitive for myocardial injury, it lacks specificity for plaque rupture and thrombotic events. This study aimed to identify novel proteomic biomarkers capable of distinguishing T1MI from other troponin-elevated conditions. In this prospective observational study, serum samples from 60 participants (T1MI: n = 32; Others: n = 28) were analyzed using liquid chromatography–tandem mass spectrometry (LC-MS/MS). A discovery cohort (n = 22) and a verification cohort (n = 60) were used. Differential protein expression was assessed using Welch’s t-test and Mann–Whitney U test (p < 0.05; fold change ≥ 1.3). Targeted validation was performed using multiple reaction monitoring (MRM). Diagnostic performance was evaluated using receiver operating characteristic (ROC) curve analysis, including sensitivity, specificity, and optimal cutoff values. A total of 216 proteins were identified, of which 29 proteins met criteria for differential expression. Targeted validation confirmed six significantly altered proteins, with three demonstrating strong diagnostic utility: Alpha-1 acid glycoprotein 2 (AGP2): sensitivity 90.6%, specificity 89.3% (cutoff <337.3 nM), Corticosteroid-binding globulin (CBG): sensitivity 86.7%, specificity 85.7% (cutoff <12.4 nM), Serotransferrin (TRFE): sensitivity 84.4%, specificity 85.7% (cutoff <0.4 nM) Patients with. T1MI showed significantly higher troponin and CK-MB levels compared to the others group (p = 0.002 for both in the verification cohort). Proteomic profiling revealed that these biomarkers are involved in inflammation (AGP2), stress response (CBG), and iron metabolism/oxidative stress (TRFE), aligning with key mechanisms of plaque rupture and thrombosis. This study identifies AGP2, CBG, and TRFE as promising biomarkers for differentiating T1MI from other troponin-elevated conditions. These markers demonstrated high diagnostic accuracy (AUC-equivalent performance ~0.85–0.91 range) and may complement troponin in clinical decision-making. Larger multicenter studies are warranted to validate their clinical utility and integration into diagnostic algorithms.
Keywords: type 1 myocardial infarction, troponin, proteomics, biomarkers, mass spectrometry
- INTRODUCTION
Every year, nearly eight million individuals presenting with symptoms of acute myocardial infarction (MI) seek medical attention at hospitals [1]. These patients receive immediate care in emergency rooms, as early diagnosis and treatment are crucial for improving outcomes [2]. Currently, the most reliable biomarker for diagnosing MI is troponin, which offers high sensitivity and minimal imprecision [3]. This test allows for rapid assessment of myocardial injury in patients [4]. Recently, the advent of high-sensitivity cardiac troponin (hs-cTn) has improved diagnostic accuracy, enabling the detection of MI in individuals who may have otherwise gone undiagnosed [5]. However, troponin levels can rise in a variety of other conditions, as it is a marker of injury to cardiac cells [6]. Different diseases can present with varying troponin concentrations, which can make distinguishing between different diagnoses challenging [7]. Myocardial infarction is classified into two primary categories: type 1 and type 2 [8]. Type 1 MI occurs due to necrosis of heart muscle resulting from a disrupted blood vessel, often due to a ruptured atherothrombotic plaque [9]. This can either narrow or completely block the affected blood vessels [10]. In contrast, type 2 MI arises from an imbalance in oxygen demand and supply, without thrombotic plaque disruption [11]. Previous studies have sought to identify novel biomarkers for distinguishing between MI types, as treatment and management strategies differ based on the type of MI [12]. These efforts have been directed at identifying markers beyond troponin [13]. One such study utilized a panel of 29 biomarkers to differentiate between type 1 MI, type 2 MI, and myocardial damage [14]. Current research primarily uses troponin to define myocardial injury in cases of acute MI, particularly in the absence of ischemia [15]. In a separate study, the effectiveness of high-sensitivity troponin I (hs-cTnI), hs-cTnT, and 17 cardiovascular biomarkers was evaluated for their ability to differentiate between type 2 MI and other forms of myocardial injury [16]. Another study examined the diagnostic potential of a six-biomarker panel to distinguish between type 1 and type 2 MI [17]. While past research has focused on differentiating between type 1 MI and type 2 MI, there remains a need for further investigation into distinguishing MI from other conditions that may present with elevated troponin levels. This study aims to identify biomarkers that can specifically differentiate type 1 MI from other conditions, including those with elevated troponin levels. By utilizing a mass spectrometry-based approach, we examined both type 1 MI and other disorders associated with high troponin levels to identify a novel biomarker. Given the well-established causes of type 1 MI, such as thrombus formation and plaque rupture, our hypothesis posits that elements related to the formation and composition of thrombus and plaque could serve as potential biomarkers for type 1 MI.
- MATERIALS AND METHODS
Samples were collected at University Hospital, Pakistan. Patients enrolled in this study either underwent a cardiac troponin assay due to suspected myocardial infarction (MI) or presented to the hospital with chest pain. Patients were categorized based on combined findings from the cardiac troponin test, coronary angiography, and electrocardiography (ECG). Those with lesions caused by coronary thrombosis or plaque rupture were classified as having type 1 MI. Patients with partial vascular stenosis, as identified by cardiologists using the fourth universal criteria, were categorized as “Others.” Blood samples were collected 48 hours after admission during coronary angiography for type 1 MI patients. For patients diagnosed with type 2 MI (due to oxygen supply-demand imbalance), blood samples were taken 48 hours post-troponin assay during hospitalization. Healthy controls without cardiovascular disease were also included in the study. All blood samples were collected using a vacutainer without anticoagulants, held at 25°C for 2 hours, and subsequently centrifuged at 4000 g for 5 minutes to extract serum. Low-abundance proteins were concentrated using a Nano-sep filter at 12,000 g. The samples were then dried under a speed vacuum. For protein extraction, a lysis buffer (0.1 M and 8 M urea Tris-HCl, pH 8.5) was used. Protein concentration was quantified using the Bicinchoninic Acid (BCA) assay, and protein concentrations were adjusted to 1 mg for pooled samples and 100 μg for individual samples. To reduce disulfide bonds, 5 mM Tris (2-carboxyethyl) phosphine (TCEP) was added to the sample, followed by incubation at 37°C for 30 minutes with gentle agitation (400 rpm). For alkylation, 15 mM iodoacetamide and 50 mM Tris-HCl were added, and the mixture was incubated at 25°C for 1 hour under similar agitation. The pH was maintained at 8.3. After alkylation, the samples were diluted seven-fold with 50 mM Tris-HCl. Tryptic digestion was carried out by adding trypsin to the samples, followed by incubation at 37°C for 15 hours with gentle shaking (800 rpm). The digestion was quenched by adding 10% formic acid (FA), lowering the pH to 3. The samples were desalted using C18 cartridges. The cartridges were cleaned with 0.1% FA, 80% acetonitrile, and 100% methanol. The entire digest volume was applied to the cartridge, rinsed seven times with 0.1% FA, and then eluted with 50% acetonitrile and 0.1% FA. The eluted peptides were dried under a Scan Speed vacuum combined with Teflon and resuspended in 0.1% FA. Peptides were fractionated by isoelectric points using a 12-well OFFGEL fractionator. Peptide identification was performed using Protein Pilot software and the Uniprot-human-SwissProt database with search parameters specifying Homo sapiens, Triple TOF 5600, Cy’s alkylation, and trypsin digestion (allowing up to two missed cleavages). Ion libraries were generated using Protein Pilot and imported into Peakview 2.2 (SCIEX) for analysis. For differential expression analysis, peptides were selected with a false discovery rate (FDR) threshold of 1% and a peptide confidence threshold of 95%. Marker View v.1.3.1 was used for protein area quantification. Data normalization was performed using the total area sum for each protein. Welch’s t-test, Mann-Whitney U test, and t-test were employed for differential protein expression between control and test groups with p-values < 0.05 and fold changes ≥ 1.3. To compare categorical variables, Fisher’s exact test was used. Continuous variables with normal distributions were analyzed using means and standard deviations, while non-normally distributed variables were expressed as medians and interquartile ranges (25th and 75th percentiles). Quantitative data from multivariate regression models (MRM) were subjected to Welch’s t-test, Mann-Whitney U test, and Kruskal-Walli’s test followed by Dunnett’s multiple comparisons and Brown-Forsythe test as appropriate. Receiver Operating Characteristic (ROC) curve analysis was conducted to assess the diagnostic accuracy of identified biomarkers, determining cutoff points, sensitivity, and specificity values. All data were analyzed using GraphPad Prism 8.4.2 for statistical analysis, and Microsoft Excel 2302 was used for variance analysis using the F-test.
- RESULTS AND DISCUSSION
This study assessed parameters from 60 participants, including 28 categorized as “Others” and 32 diagnosed with type 1 myocardial infarction (T1MI). For the discovery set, statistical analysis compared 12 patients from the T1MI group with 10 patients from the others group. Patients were randomly selected. In the verification set, all subjects were examined. The cohort comprised 37 men, with a median age of 73 years (61.7% male). No significant differences were observed in the distributions of sex and age between the two analysis groups. In the discovery set, peak levels of troponin and CK-MB (creatine kinase MB) isoenzyme were significantly higher in the T1MI group compared to the others group (T1MI vs. Others, p = 0.014 and p = 0.009, respectively). In the verification set, statistically significant differences were observed in several parameters: current smokers (T1MI vs. Others, p = 0.043), ECG results (ST-depression: T1MI vs. Others, p = 0.02; non-specific changes: T1MI vs. Others, p < 0.0001; ST-elevation: T1MI vs. Others, p = 0.007), and both biomarkers of heart disease (CK-MB: T1MI vs. Others, p = 0.002; troponin: T1MI vs. Others, p = 0.002). Higher values for all these parameters were observed in individuals with type 1 MI compared to those in the others group, with the exception of nonspecific ECG abnormalities (Table 01).
Table 01: Characteristics of Baseline
| All | Verification | Discovery | |||||
| Others a | T1MI | p-Value | Others a | T1MI | p-Value | ||
| Male, n (%) | 37 (61.7) | 15 (53.6) | 22 (68.8) | 0.291 | 4 (40) | 10 (83.3) | 0.074 |
| Systolic BP, mmHg | 130.4 ± 19.9 | 134.4 ± 21.3 | 126.9 ± 18.1 | 0.149 | 133.5 ± 12.7 | 135.3 ± 14.4 | 0.768 |
| Age (year) | 73 (60.5, 80) | 72.5 (59, 80.8) | 74 (62.0, 79.8) | 0.805 | 70.1 ± 17.5 | 69.6 ± 11.6 | 0.935 |
| Past Medical History | |||||||
| Previous heart failure | 19 (31.7) | 9 (32.1) | 10 (31.3) | >0.999 | 2 (20) | 3 (25) | >0.999 |
| Previous revascularization | 9 (15) | 3 (10.7) | 6 (18.8) | 0.192 | 1 (10) | 2 (16.7) | >0.999 |
| Previous myocardial infarction | 5 (8.3) | 2 (7.1) | 3 (9.4) | >0.999 | 1 (10) | 1 (8.3) | >0.999 |
| Risk Factors | |||||||
| Current smoker | 13 (21.7) | 4 (14.3) | 13 (40.6) | 0.043 | 0 (0) | 4 (33.3) | 0.096 |
| Hyperlipidemia | 19 (31.7) | 10 (35.7) | 9 (28.1) | 0.586 | 5 (50) | 3 (25) | 0.377 |
| Diabetes | 25 (41.7) | 14 (50.0) | 11 (34.4) | 0.296 | 6 (60) | 3 (25) | 0.192 |
| Past smoker | 9 (15) | 5 (17.9) | 4 (12.5) | 0.721 | 2 (20) | 2 (16.7) | >0.999 |
| CAD family history | 6 (10) | 2 (7.1) | 4 (12.5) | 0.675 | 1 (10) | 1 (8.3) | >0.999 |
| Hypertension | 32 (53.3) | 16 (57.1) | 16 (50.0) | 0.613 | 7 (70) | 5 (41.7) | 0.231 |
| Laboratory Findings | |||||||
| CK-MB, ng/mL | 23 (7.7, 64.9) | 13.5 (5.6, 36.1) | 51.0 (10.7, 137.6) | 0.002 | 7.3 (5.0, 18.8) | 31.7 (10.8, 104.7) | 0.009 |
| Hemoglobin, g/dL | 12.6 ± 2 | 12.1 ± 2 | 12.9 ± 2 | 0.115 | 11.9 ± 2.1 | 13.19 ± 2 | 0.186 |
| Peak troponin, ng/mL | 0.9 (0.3, 2.5) | 1.90 ± 1.2 | 2.7 ± 2.6 | 0.002 | 0.3 (0.2, 0.5) | 1.4 (0.5, 2.1) | 0.014 |
A total of 208 proteins in the T1MI group and 205 in the others group were identified from the DIA data, with 216 proteins matching the spectrum library (Figure 1). Among these, 208 proteins from the A-group subset and the intersection with the B-group were selected for marker analysis. Based on t-test results, 29 proteins met the criteria (p < 0.77 and 0.05-fold change or fold change ≥ 1.3) (Supplementary Table S2). Peptides had ≥ 94% purity, and all calibration curves, except for apolipoprotein B-100, had R² > 0.99. The MRM method quantified 13 of 14 proteins, including four (CD40 ligand, MPO, PAP-PA, MMP9) associated with plaque rupture and coronary artery disease, used as MI markers. Final method parameters and peptide-dependent ion transitions are listed in Table 2. Six proteins showed significant differences between groups (excluding outliers): Alpha-1 acid glycoprotein 2, Alpha-1 acid glycoprotein 1, CD40 ligand, cathelicidin antimicrobial peptide, and corticosteroid-binding globulin (all p < 0.0001) (Figure 01).
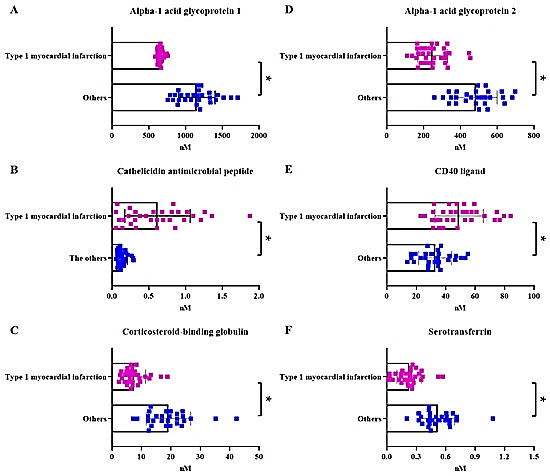
Figure 01: Graphical explanation of spread-out.
Table 02: A comparison of markers’ diagnostic capacities
| Protein | Specificity | Sensitivity | Cut-off Value (nM a) |
| Serotransferrin | 85.7 (68.5–94.3) | 84.4 (68.3–93.1) | <0.4 |
| Corticosteroid-binding globulin | 85.7 (68.5–94.3) | 86.7 (70.3–94.7) | <12.4 |
| 𝛼α-1 acid glycoprotein 2 | 89.3 (72.8–96.3) | 90.63 (75.8–96.8) | <337.3 |
Protein marker expression patterns were shown to be different between the disease group and healthy control group (free of the cardiovascular disease group) (Supplementary Table S3). The majority of the time, the proteins that had previously been identified as being associated with each disease showed statistically significant differences between the type 1 MI and healthy groups (Supplementary Figure S1). Acute myocardial infarction (MI) is one of the leading causes of morbidity and mortality worldwide. It occurs when blood flow to a region of the heart muscle is obstructed, leading to damage and the release of various biomarkers into the bloodstream. The most widely recognized and utilized biomarker for diagnosing MI is cardiac troponin, which is a protein found in the heart muscle. However, despite its effectiveness, the use of troponin alone for diagnosis presents limitations, particularly in distinguishing between different types of MI and other conditions that also cause elevated troponin levels. To address this challenge, our study aimed to identify additional biomarkers capable of distinguishing type 1 myocardial infarction (T1MI) from other diseases associated with elevated cardiac troponin levels [18]. Troponin is considered the gold standard biomarker for diagnosing MI due to its high sensitivity and specificity for detecting myocardial injury. However, troponin levels can also be elevated in a range of other disorders, including type 2 myocardial infarction (T2MI), renal failure, and pulmonary embolism. T2MI, for example, occurs due to an imbalance between oxygen supply and demand in the heart, rather than a rupture or blockage of the coronary arteries as in T1MI. Given that troponin can be elevated in various conditions, it is crucial to identify additional biomarkers that can distinguish between these conditions, particularly in the context of MI subtypes [19]. Our study aimed to identify such biomarkers by utilizing mass spectrometry (MS) in a nontargeted approach, which allows for the identification of proteins without prior knowledge of their presence in the sample. This approach is highly beneficial for discovering potential biomarkers in diseases like MI, where the underlying pathophysiology can involve complex interactions of various proteins. In addition to mass spectrometry, we used multiple reaction monitoring (MRM), a targeted technique that enables the quantification of specific proteins without the need for antibodies, making it both cost-effective and efficient [20]. To differentiate T1MI from other conditions with elevated cardiac troponin, we analyzed serum samples from patients with T1MI, T2MI, and other conditions known to elevate troponin. A total of 208 proteins were identified in the T1MI group and 205 proteins in the other conditions group. From this large dataset, 216 proteins were matched to the spectrum library via data-independent acquisition (DIA) data. The 208 proteins from the subset of the A-group and the intersection with the B-group were then selected for marker analysis [21]. Our analysis revealed that 29 proteins met the criteria for potential biomarkers, based on a t-test with a p-value of less than 0.77 and a fold change greater than 1.3. These proteins were further examined using MRM, and we identified three biomarkers that were highly successful in differentiating T1MI from other conditions: corticosteroid-binding globulin (CBG), alpha-1 acid glycoprotein 2 (AGP2), and serotransferrin (TRFE). These biomarkers were chosen for their relevance to the pathophysiology of MI, particularly because of their involvement in processes such as inflammation, oxidative stress, and thrombus formation [22]. AGP2 is an acute-phase protein primarily synthesized in the liver, although it can also be found in the myocardium. Under normal conditions, the levels of AGP2 are relatively low; however, during acute-phase responses, triggered by inflammatory cytokines such as interleukin-1 (IL-1), tumor necrosis factor-alpha (TNF-α), and IL-6, AGP2 levels increase dramatically. This elevation occurs as part of the body’s immune response to repair necrotic tissue, a process that is central to the pathophysiology of MI. In our study, we found that AGP2 levels were significantly elevated in the “Others” group, which may indicate the presence of other pathophysiological diseases or syndromes. However, the levels of AGP2 in the T1MI group were also elevated, suggesting its potential role as a clinical marker for differentiating T1MI from other conditions [23]. Further research is needed to confirm the precise relationship between AGP2 and different diseases, as its elevated levels could also be associated with other inflammatory or infectious conditions. CBG is a protein that primarily binds to glucocorticoids such as cortisol, modulating their free concentrations in the bloodstream. CBG is mainly synthesized in the liver, but it is also present in the myocardium. It has been suggested that CBG plays a crucial role in regulating the bioavailability of cortisol, which is essential for controlling inflammation and stress responses. During inflammation, the affinity of CBG for cortisol decreases, leading to an increase in the levels of free cortisol, which has biological activity in clinical settings [24]. Our study showed a marked decrease in CBG levels in the T1MI group compared to controls. This reduction may be associated with the inflammatory processes that occur during MI, as CBG synthesis is often suppressed during acute-phase responses. The lower CBG levels in T1MI patients align with findings from other studies that have linked reduced CBG expression to various inflammatory conditions. This suggests that CBG could serve as a useful biomarker for distinguishing T1MI from other inflammatory diseases or conditions that also elevate troponin levels [25]. TRFE, or serotransferrin, is a negative acute-phase protein that plays a central role in regulating iron homeostasis in the body. Iron is essential for various cellular processes, including oxygen transport and mitochondrial function. However, dysregulation of iron homeostasis can lead to oxidative stress, which has been implicated in the pathogenesis of atherosclerosis and MI. In our study, we found a significant decrease in TRFE levels in the T1MI group, suggesting that iron overload may play a role in the development of MI [26]. Increased oxidative stress, caused by elevated blood iron levels, can lead to the generation of reactive oxygen species, which damage blood vessels and promote thrombus formation. Our findings support the hypothesis that increased oxidative stress in MI, driven by excess iron, contributes to the development of atherosclerotic plaques and thrombus formation. This highlights the importance of iron homeostasis in the context of MI and suggests that TRFE could be a valuable biomarker for detecting T1MI [27]. Despite the promising results of this study, there are several limitations that should be addressed in future research. First, the small sample size of the study limits the generalizability of the findings. Larger, multicenter studies are needed to confirm the biomarkers identified in this study and to validate their diagnostic utility in diverse patient populations. Additionally, the control group in this study lacked sufficient diversity to represent all disorders with elevated troponin levels. Future studies should include a more comprehensive set of controls to ensure the biomarkers identified are truly specific to T1MI [28]. Moreover, there is currently no evidence regarding the diagnostic value of these biomarkers when combined with troponin. Further studies should explore the potential of these biomarkers to complement troponin in diagnosing T1MI, and whether they can provide additional diagnostic information that could improve clinical outcomes.
- CONCLUSIONS
A total of 216 proteins were identified, of which 29 proteins met criteria for differential expression. Targeted validation confirmed six significantly altered proteins, with three demonstrating strong diagnostic utility: Alpha-1 acid glycoprotein 2 (AGP2): sensitivity 90.6%, specificity 89.3% (cutoff <337.3 nM), Corticosteroid-binding globulin (CBG): sensitivity 86.7%, specificity 85.7% (cutoff <12.4 nM), Serotransferrin (TRFE): sensitivity 84.4%, specificity 85.7% (cutoff <0.4 nM) Patients with. T1MI showed significantly higher troponin and CK-MB levels compared to the others group (p = 0.002 for both in the verification cohort). Proteomic profiling revealed that these biomarkers are involved in inflammation (AGP2), stress response (CBG), and iron metabolism/oxidative stress (TRFE), aligning with key mechanisms of plaque rupture and thrombosis. This study identifies AGP2, CBG, and TRFE as promising biomarkers for differentiating T1MI from other troponin-elevated conditions. These markers demonstrated high diagnostic accuracy (AUC-equivalent performance ~0.85–0.91 range) and may complement troponin in clinical decision-making. Larger multicenter studies are warranted to validate their clinical utility and integration into diagnostic algorithms. This study identifies three novel biomarkers—AGP2, CBG, and TRFE—that can help differentiate T1MI from other conditions with elevated troponin. These biomarkers, which are involved in inflammation, oxidative stress, and iron metabolism, have the potential to complement troponin in the diagnosis of T1MI. Further validation in larger, diverse populations is necessary to confirm their diagnostic utility and to assess their role in clinical practice.
REFERENCES
- Mechanic, O. J., Gavin, M., & Grossman, S. A. (2022). Acute myocardial infarction. StatPearls.
- Guan, W., Venkatesh, A. K., Bai, X., et al. (2019). Time to hospital arrival among patients with acute myocardial infarction in China: A report from the China PEACE prospective study. European Heart Journal – Quality of Care and Clinical Outcomes, 5(1), 63–71.
- Saczynski, J. S., Yarzebski, J., Lessard, D., et al. (2018). Trends in prehospital delay in patients with acute myocardial infarction (from the Worcester Heart Attack Study). The American Journal of Cardiology, 102(12), 1589–1594.
- Herlitz, J., Blohm, M., Hartford, M., et al. (2019). Follow-up of a 1-year media campaign on delay times and ambulance use in suspected acute myocardial infarction. European Heart Journal, 13(2), 171–177.
- Wang, X., & Hsu, L. L. (2018). Treatment-seeking delays in patients with acute myocardial infarction and use of the emergency medical service. Journal of International Medical Research, 41(1), 231–238.
- Ting, H. H., Chen, A. Y., Roe, M. T., et al. (2020). Delay from symptom onset to hospital presentation for patients with non–ST-segment elevation myocardial infarction. Archives of Internal Medicine, 170(20).
- Berger, P. B., Ellis, S. G., Holmes, D. R., et al. (2019). Relationship between delay in performing direct coronary angioplasty and early clinical outcome in patients with acute myocardial infarction. Circulation, 100(1), 14–20.
- Bucholz, E. M., Strait, K. M., Dreyer, R. P., et al. (2019). Effect of low perceived social support on health outcomes in young patients with acute myocardial infarction: Results from the VIRGO study. Journal of the American Heart Association, 3(5).
- Mitchell, P. H., Powell, L., Blumenthal, J., et al. (2018). A short social support measure for patients recovering from myocardial infarction. Journal of Cardiopulmonary Rehabilitation, 23(6), 398–403.
- Moses, H. W., Engelking, N., Taylor, G. J., et al. (1991). Effect of a two-year public education campaign on reducing response time of patients with symptoms of acute myocardial infarction. The American Journal of Cardiology, 68(2), 249–251.
- Jamil, R., & Anwar, S. (2023). Cardiovascular findings in women delivered at advanced maternal age. Dinkum Journal of Medical Innovations, 2(11), 466–472.
- Nizam-ul-Haq, & Mondal, J. (2023). A review of the literature on nutrition, dietary habits, and dental hygiene in elderly individuals. Dinkum Journal of Medical Innovations, 2(11), 473–483.
- Bhattarai, P., & Jha, P. K. (2023). Significance of the COVID-19 pandemic on adult nutritional practices, dental cleanliness, and caries disease. Dinkum Journal of Medical Innovations, 2(11), 484–490.
- Ahmed, T., Rehman, Y., & Kausar, A. (2023). Associations between the sustainable development goals and oral health. Dinkum Journal of Medical Innovations, 2(11), 491–499.
- Ahammed, M., Ferdous, T., & Shoron, R. (2023). Coronary disease and drawbacks for women: Literature review. Dinkum Journal of Medical Innovations, 2(11), 500–507.
- McGinn, A. P., Rosamond, W. D., Goff, D. C., Taylor, H. A., Miles, J. S., & Chambless, L. (2020). Trends in prehospital delay time and use of emergency medical services for acute myocardial infarction: Experience in four US communities from 1987–2000. The American Heart Journal, 150(3), 392–400.
- Moser, D. K., Kimble, L. P., Alberts, M. J., et al. (2019). Reducing delay in seeking treatment by patients with acute coronary syndrome and stroke. Circulation, 114(2), 168–182.
- Herlitz, J., Blohm, M., Hartford, M., et al. (2020). Follow-up of a 1-year media campaign on delay times and ambulance use in suspected acute myocardial infarction. European Heart Journal, 13(2), 171–177.
- Gerber, Y., Weston, S. A., Jiang, R., & Roger, V. L. (2019). The changing epidemiology of myocardial infarction in Olmsted County, Minnesota, 1995–2012. The American Journal of Medicine, 128(2), 144–151.
- Thygesen, K., Alpert, J. S., & White, H. D. (2017). Universal definition of myocardial infarction. Journal of the American College of Cardiology, 50(22), 2173–2195.
- Salari, N., Morddarvanjoghi, F., Abdolmaleki, A., et al. (2023). The global prevalence of myocardial infarction: A systematic review and meta-analysis. BMC Cardiovascular Disorders, 23(1), 1–12.
- Yeh, R. W., Sidney, S., Chandra, M., Sorel, M., Selby, J. V., & Go, A. S. (2018). Population trends in the incidence and outcomes of acute myocardial infarction. The New England Journal of Medicine, 362(23), 2155–2165.
- Liew, R., Sulfi, S., Ranjadayalan, K., Cooper, J., & Timmis, A. D. (2018). Declining case fatality rates for acute myocardial infarction in South Asian and white patients. Heart, 92(8), 1030–1034.
- Lewis, E. F., Moye, L. A., Rouleau, J. L., et al. (2020). Predictors of late development of heart failure in stable survivors of myocardial infarction. Journal of the American College of Cardiology, 42(8), 1446–1453.
- Assante, R., Zampella, E., Acampa, W., et al. (2019). Prevalence and severity of myocardial perfusion imaging abnormalities in inmate subjects. PLoS ONE, 10(7), e0133360.
- Velagaleti, R. S., Pencina, M. J., Murabito, J. M., et al. (2018). Long-term trends in the incidence of heart failure after myocardial infarction. Circulation, 118(20), 2057–2062.
- Chung, E. H., Curran, P. J., Sivasankaran, S., et al. (2017). Prevalence of metabolic syndrome in patients ≤45 years with acute myocardial infarction undergoing PCI. The American Journal of Cardiology, 100(7), 1052–1055.
- Bosch, X., Loma-Osorio, P., Guasch, E., Nogué, S., Ortiz, J. T., & Sánchez, M. (2020). Prevalence and risk of myocardial infarction in patients with cocaine-related chest pain. Revista Española de Cardiología, 63(9), 1028–1034.
Publication History
Submitted: October 27, 2025
Accepted: November 22, 2025
Published: December 31, 2025
Identification
D-0558
DOI
https://doi.org/10.71017/djmi.4.12.d-0558
Citation
Md. Abdul Kader & Mohammad Tanvir Islam (2025). Identification of Potential Biomarkers to Differentiate Type 1 Myocardial Infarction in Diseases with Elevated Troponin Levels . Dinkum Journal of Medical Innovations, 4(12):855-863.
Copyright
© 2025 The Author(s).