


Publication History
Submitted: October 25, 2024
Accepted: November 22, 2024
Published: April 31, 2025
Identification
D-0583
DOI
https://doi.org/10.71017/djnsi.4.4.d-0583
Citation
Govinda Prasad Khanal , Kanta Poudyal & Biva Aryal (2025). Effect Of Anthropogenic Effect on the Carbon Stock of Forest in PHULCHOKI Hill. Dinkum Journal of Natural & Scientific Innovations, 4(04):229-246.
Copyright
© 2025 The Author(s).

229-246
Effect Of Anthropogenic Effect on the Carbon Stock of Forest in PHULCHOKI HillOriginal Article
Govinda Prasad Khanal 1*, Kanta Poudyal 2, Biva Aryal 3
- Lecturer, Sadharan Mavi Gangadi, (Salbhauri), Dang District, Lumbini Province, Nepal.
- Professor, Amrit Campus, Tribhuvan University, Kathmandu, Nepal.
- Associate Professor, Amrit Campus, Tribhuvan University, Kathmandu, Nepal.
* Correspondence: gkhanal11@gmail.com
Abstract: Plant diversity and disturbances influences vegetation production, carbon sequestration, and other ecosystem processes. Forest plays an important role in global carbon cycle being the source and sink of carbon (C) depending upon specific management regimes and activities. This study estimated the carbon stock value of Phulchoki forest and to evaluate the impact of disturbance on it. It was carried out in three different types of forest at the southern slope of Phulchoki hill ranged from 1530m to 2715 m above sea level. Circular quadrate of 8.92-meter radius was used to calculate the tree carbon stock value. Carbon stock value of Schima-Castonopsi Forest, Oak laurel forest and Q.semecarpifolia forest was estimated as 231.24±79.44 Ct/ha, 261.82±61.06 Ct/ha, and 615.97±253.35 Ct/ha respectively. Soil carbon for all three forests; Schima-Castonopsis, Oak-laurel and Q. semecarpifolia was estimated like 80.49±34.26 t ha-1, 109.1±42.56 t ha-1 and 101.15±30.82 t ha-1 respectively. Invasive species like Ageratina adenophora was also recorded near road side in barren area. Forest of lower altitude near Godawori Park was found as highly disturbed as compared with others. Fire effect was mostly observed in mid altitude. Carbon stock in heavily disturbed site and moderately disturbed site was 286.49Ct ha-1 and 196.33Ct ha-1 less than undisturbed site. Soils physio-chemical properties were also studied in each type of forest and impact of disturbance on it was also observed. For soil study composite soil samples of three different depths (0-10cm, 10-20cm, 20-30cm) was used. Disturbance has altered the soil properties as disturbed site has low organic carbon, and N, P, K values as compared to undisturbed site. The OC%, N, P and K value in undisturbed site of Q.semecarpifolia forest were 3.41±0.82%, 1.1±0.12%, 26.78±0.03kg ha-1, and 495.8±4.28 kg ha-1 respectively. Bulk densities for Schima-Castanopsis, Oak-laurel and Q. semecarpifolia forest were recorded as 0.96±0.09, 1.04±0.07 and 0.98±0.14 respectively. Forest soil was detected slightly acidic as pH is less than 8.
Keywords: Carbon stock, Disturbance, Phulchowki, Schima-Castanopsis, Oak-laurel, Q. semecarpifolia
- INTRODUCTION
Plant diversity and disturbances influences vegetation production, carbon sequestration, and other ecosystem processes. Forest plays an important role in global carbon cycle being the source and sink of carbon (C) depending upon specific management regimes and activities [1]. Forest vegetation and soil shares almost 56% of world’s terrestrial carbon [2]. Estimating Carbon stock under existing forest land, and their distribution within the soil profile, provides baseline data to enable us to project C sequestration over time [3]. The carbon stock in a forest ecosystem can be broadly categorized into biotic (vegetative carbon) and pedologic (soil carbon) components. As trees grow, they sequester carbon in their tissues, and as the amount of tree biomass increases, the atmospheric carbon dioxide (CO2) is mitigated. About 43–50% of the dry biomass of trees is carbon [4]. Forest ecosystems play a crucial role in climate change mitigation by acting as sinks [5,6]. Carbon dioxide from the atmosphere is accumulated in terms of the organic matter in soil and trees, and it continuously cycles between forests and the atmosphere through the decomposition of dead organic matter [7]. Forest ecosystems are estimated to store about 44% in biomass, 11% in necro mass and 45% in soils [8] but this range varies across biomes. Trees act as a sink for CO2 by fixing carbon during photosynthesis and storing excess carbon as biomass [9]. The amount of carbon stored in a forest stand depends on its age and productivity [10]. Productivity estimates are fundamental in order to evaluate the potential of forest ecosystems and their capacity to sequester carbon. In undisturbed forests, total ecosystem carbon stocks generally increase with stand age as pools of living biomass, forest floor material (organic soil horizons), and mineral soil carbon accumulate through stand development before ultimately leveling off in older stands [11,12]. Soil contains the major part of carbon in terrestrial ecosystems. The Kyoto Protocol recognized the importance of forest in mitigating the greenhouse gas emission (i.e. carbon dioxide, methane and other compounds) and has included forest and soil C sequestration in the list of acceptable offsets [13]. Thus, reducing emission from deforestation and forest degradation has emerged as an incentive mechanism for developing countries. However, updated national forest inventory data and technical capacity is poor; and accounting of changes in forest cover biomass stock, carbon emission and carbon removal are limited in the developing countries like Nepal [14]. The carbon stock in forest vegetation varies according to geographical location, plant species and age of the stand [15]. Estimates of the biomass contained within forests are critical aspects of determination of the carbon loss associated with a wide range of land use and land-cover change processes. In order to assess the impact of deforestation and re-growth rates on the global carbon cycle, it is necessary to know the stocks of carbon as biomass per unit area for different forest types. The above-ground biomass and below-ground biomass both need to be measured to enable better calculations of total forest carbon [16]. Most studies on carbon sequestration have focused on carbon stocks in different land uses [17]. Others have focused on organic carbon stocks in different forest soils of Nepal [18,19]. Nepal being member of Forest Carbon Partnership Facility (FCPF), an innovative approach to financing efforts to combat climate change and Quantification of sequestered C in different forest types with different management regimes and soil profiles. This could be important for better planning of natural resources, and the making of good mitigation strategy for climate change effects. Soil carbon is an important part of terrestrial carbon pool and soils of the world are potentially viable sinks for atmospheric carbon [20]. Carbon sequestration in soils is a climate change-mitigating strategy, based on the assumption that movement, or flux, of carbon from the air to the soil can be increased while the release of carbon from the soil back to the atmosphere is decreased. Soil store of organic carbon globally – about twice as much C as found in the atmosphere and three times the quantity contained in terrestrial vegetation [21]. Soil can be a source or a sink of atmospheric C depending upon land use and management. Land use and vegetation type influence soil erosion and C dynamics through its effect on Soil organic carbon (SOC) contents, CO2 flux and dissolved organic carbon (DOC) leached from soil [22]. Soil is deteriorating at an alarming rate of low C sequestration in developing countries like Nepal due to land use changes [8]. In this context, there is dire need to conduct research related to C pools and C sequestration [16] among different land uses. Anthropogenic modifications to the global SOC pool have become areas of interest in numerous past studies, as agriculture/tilling [10], grazing pressure [11], and differing land-use management practices [9] can all profoundly affect soil carbon and nitrogen dynamics from local to global scales. Most importantly, soil and vegetation C can help to mitigate increasing atmospheric CO2 [15]. SOC storage is largely dependent on regional climatic conditions: temperature and precipitation control the input of live biomass to soils, and the rate at which it cycles through the terrestrial SOC pool [13]. Past studies have examined the relationship between SOC and changes in climate [13,14], as changes in global SOC stock could directly affect the concentration of greenhouse gases in the atmosphere [17]. Previous work defining SOC stock in the Himalaya have shown high SOC densities in forest soils, with deciduous forests (the dominant forest type in India) revealing a pool of 2.64 Pg C in the top 1m soil depth [19]. Deforestation and forest degradation are two important dimensions of environmental change that are directly related to global warming and pose threats to biodiversity and carbon pool of the forest. Deforestation refers to complete loss of forest cover. Forest degradation relates to loss of biomass (carbon) and reduction in the capacity of forests to produce ecosystem services [12]. Understanding human-induced causes of deforestation and forest degradation in different social, economic and ecological context is one of the key and contentious questions in environmental change research. In Nepal, there have been several studies aimed at explaining the causative pattern of forest cover changes in different pocket areas during the last two decades [16]. Some of the drivers are common while the others vary across the physiographic regions. Change in Forest Cover: Between 1990 and 2000, Nepal lost an average of 91,700 hectares of forest per year. The amounts to an average annual deforestation rate of 1.90%. Between 2000 and 2005, the rate of forest change decreased by 28.9% to 1.35% per annum. In total, between 1990 and 2005, Nepal lost 24.5% of its forest cover, or around 1,181,000 hectares [19]. The innovations of different forest management approaches and expansion of forestry administration have not been fully successful in halting or reversing the deforestation trends in the country as the available data show that the country’s forest area decreased continuously since 1964. According to department of forest [19] and LRMP (1986 AD) The forest area decreased from 45.5 % in 1964 to 38.1 % in 1978/79 and to 29 % in 1994). Many community forestry projects in earlier days were designed to deal with energy supply and land degradation problems mentioned in the so called “Theory of Himalayan Degradation”, rather than to solve the problem of meeting local needs for trees and tree products. According to the report there are 18,133 forest user groups, managing 1.7 million hectares of forest area [19]. Tropical Deforestation and forest degradation account for an 20% loss of the world’s anthropogenic emission of carbon dioxide [23]. Deforestation in forest ecosystem affects resource levels, such as soil organic matter, water and nutrient availability; and interception of solar radiation. In developing country like Nepal most of rural people depends on variety of forest resources such as timber, fuel wood, charcoal burning, Extraction of building materials in particular poles, collection of wild fruits, medicine etc. which have their own pressure on forest resources, consequently forest resources become decline through time due to such activity [23]. This study played a significant role to generate data on carbon stock and potential of forest to store carbon are also be known. It is a database for decision making and negotiating for carbon in international areas.
- MATERIALS AND METHODS
The study was carried out in the south east facing slope of Phulchowki Hill of Godawari Municipality, Lalitpur district. Phulchowki Hill lies at longitude 85˚22’to latitude 27˚34’of sub- Himalaya Mahabharat region with an altitudinal range of 1400- 2715m (Figure 01). This area is popular hiking destinations in Nepal for its rich wildlife and splendid environment and located at south east of 10 km from Kathmandu ring road is the highest peak in Kathmandu valley. The forest is mostly dominated by broad evergreen forest and is characterized by three types of forests; a Mixed Schima-Castonopsis Forest (1450-1800m), Oak-laurel Forest (1800-2400m) and Q. semecarpifolia forest (above2300 m) [24]. The study area has warm temperate monsoon climate with three seasons round the year: cold and dry winter (October to February), pre monsoon dry summer (March to May) and monsoon (June to September). Climate data from 2014 to 2018 showed that the average maximum temperature was recorded in June (28.82˚C) and average minimum temperature was recorded in January (17.84˚C) (Figure 02). Average maximum precipitation was recorded in July (415.28mm) and at the month of November and there was no precipitation in all the year (fig 2). Total rainfall from year 2014- 2018 was 1410mm year-1,1218mm year-1, 1474.33 mm year-1, 1334.9 mm year-1, and 1401.3 mm year-1 respectively. Highest rainfall was recorded in August (554.1 mm) of 2018. Maximum temperature was recorded in April (29˚C) of 2016 and minimum temperature was recorded in January (0.4˚C) of 2014 (Figure 02). No rainfall was recorded in October, November and December.
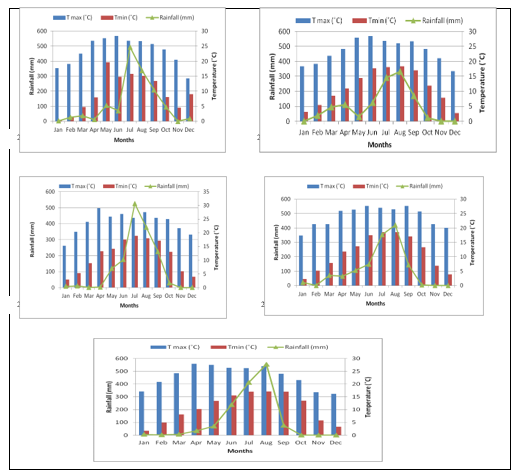
Figure 01: Five years (2014-2018) average monthly minimum, maximum temperature and rainfall recorded at Godawari weather Station (Station that is nearest from the Phulchoki area). (Source: Department of Hydrology and Meteorology, Babarmahal, Kathmandu, Nepal).
At the lower belt (up to 1800 m) Schima-Castanopsis Forest is found, the dominant tree species in this forest are Schima wallichii, Castanopsis indica, C. tribuloides and the associated species with them are Alnus nepalensis, Eurya acuminata, Prunus cerasoides. In the middle belt (2000 m to 2300 m) Mixed Oak Forest is found. The dominant trees in this belt are Quercus lanata, Rhododendron arboreum, Quercus glauca. The associated species with them are Eurya acuminata, Lyonia ovalifolia, Myrsine semiserrata, Q. semecarpifolia, Michelia champaca, Rhus succedanea. In the upper belt (2300 m to 2715m) Oak Forest is found. The dominant tree species in this belt are Quercus semecarpifolia, Rhododendron arboreum. The other trees associated with them are Pieris formosa, Ilex excelsa, Viburnum nervosum, Lindera pulcherima. Systematic random sampling was done to measure the carbon stock and disturbance categories. Circular nested plot was established to measure carbon stock. Within the main plot, radius 8.92 m was applied to measure above ground tree biomass (AGB) (DBH≥5cm), nested plot with 5.64m radius for shrub, saplings (DBH>1cm and <5cm) and 0.56m radius was used for collection of soil from different altitudes [25] (Figure 02). Total Ninety plot was laid (approximately 2%) of total area. Interval between two plots was 50m (Figure 03). Anthropogenic disturbances classes were categorized on the basis number of lopping species, cut stumps, coverage of ground vegetation, burnt area, trampling etc.
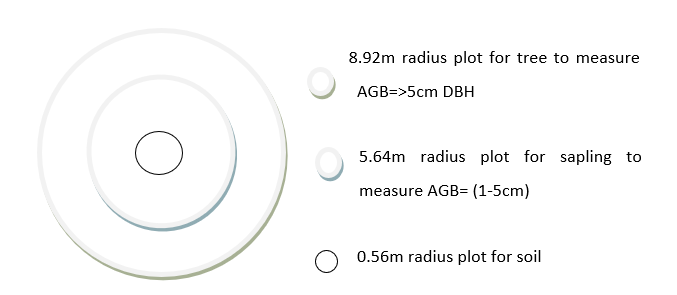
Figure 02: sampling design for circular plot
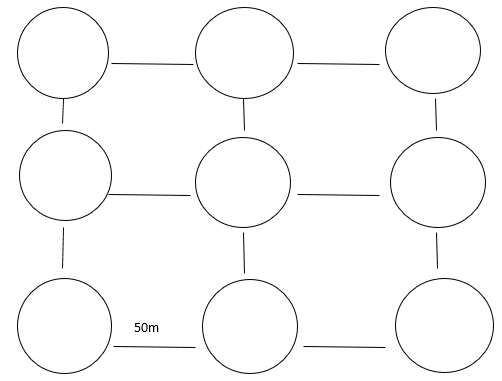
Figure 03: Layout of Sampling Design for distribution of plot
Soil samples were collected from 0.56m radius within the main sampling plots from different altitudes. Volumetric soil samples were collected from the center of each plot from three different depths (0-10cm, 10-20cm, 20-30cm). The collected sample from three depths were mixed with each other and made composite samples. Collected soil samples were mixed and about half kg of soil sample were taken from each plot to the laboratory for further measurements. Soil samples were air dried in shade and ground with mortal pestle and different physic-chemical attributes were determined as follows. The collected soil samples were taken to the laboratory for the analysis of soil organic carbon, Bulk density, Soil texture, moisture, pH, N, P, K to find out the soil characteristics of that area. Unknown plant specimens were collected and tagged in the field with the help of plastic bags and newspapers. Collected specimens were pressed with the help of herbarium pressure. The key characters of plants were documented as field note book (color of flowers, fruits and fragrance). Collected plants were identified with the help of experts, annotated checklist of flowering plants of Nepal [26]. Those unidentified were identified in National Herbarium and Plant laboratory (KATH). The ABG of the tree includes the wood, branches, leaves etc., were measured by following formula. Diameter at Breast Height (DBH) of the trees was measured by using DBH tape. Heights of the trees were calculated by the help of clinometers.
Volume of the trees were calculated by πr2h/2 [27].
where r radius (dbh/2), h/2 = Height of the tree
Biomass was calculated by multiplying volume of the species with specific wood density [28].
Biomass = Specific wood density× volume
Above ground biomass (AGB) was calculated by adding biomass of pole, branch and leaf.
AGB= Pole biomass+ branch biomass+ leaf biomass
Below ground biomass was calculated by multiplying AGB by 0.2% (20%).
BGB = AGB×0.2 (20%)
Carbon analysis was calculated by multiplying biomass by 0.47% (47%).
Carbon = Biomass× 0.47
Total carbon stock = AGC+BGC (root+ soil)
Density of tree species was calculated by using following formula described in [29].
| × 10000 |
Density (Tree ha-1) = Total number of individuals of a species
Total number of quadrats studied ×Area of quadrats
Forest disturbances were analyzed by counting cut stems, crown coverage, logged trees and measuring fire, by additionally observing the forest structure and asking local people, staff members of community forest. Disturbance class was divided in three categories namely heavily disturbed, moderately disturbed and undisturbed according to forest condition like logged trees, forest fire, crown coverage, seedling and sapling numbers etc.
Disturbance % = × 100
Soil textures were analyzed by using sieve of different size. Soil samples were grounded with pestle and transferred to sieve. Obtained soil from different sieve size were weighed and percent of each soil was calculated. Finally soil types was obtained using graph [27].
Organic carbon was determined by rapid titration method, as demonstrated by [30]. In this method 1.0 g of soil was digested with mixture of 10 ml potassium dichromate and 20 ml of concentrated sulphuric acid. The excess of potassium dichromate not reduced by the organic matter of soil was determined by titration using standard ferrous ammonium sulphate solution in the presence of sodium iodide using diphenyl amine as an indicator.
Organic carbon in soil (%) =
Where,
N= Normality of ferrous ammonium sulphate (0.5 N).
B= Volume of ferrous ammonium sulphate for blank titration (ml).
S= Volume of ferrous ammonium sulphate for sample titration (ml)
M = Mass of dry soil (g)
Total Soil organic carbon (SOC) in t ha-1 was calculated by using following formula
SOC (t ha-1) = Total SOC = Organic carbon content% x soil bulk density (kg/m3) x thickness of horizon (m) [24].
The pH of collected soil sample was measured using standard pH electrode. 5 gm of each soil sample was mixed with 10ml of distilled water. Calibration was done with standard buffer solution of pH 4 and pH 7 for accurate result. After calibration electrode was dipped in solution of sample and reading was noted. This method was repeated for three times to get concurrent result [26]. Bulk density (BD) was measured by core method [16]. Cylindrical metal core of length 30 cm was inserted into the soil to the depth of 30 cm and was carefully removed to preserve known volume of sample. This process was carried out in all 5 plots of three different forests sites. The sample was dried at 70˚C to 80˚C and weighed.
BD (gm/cm3) =
Ten gm of soil sample was grinded and passed through 0.5 mm sieve and oven dried at 105˚C. 1 gm of organic sample was transferred into 100 ml of digestion tube. Then 1 gm of Kjeldahl was added with 9 ml of conc. H2SO4 that the sample is completely immersed at the bottom of tube. The sample was heated at 420˚C up to 4 hours and allows to cool for 30 min. 50 ml of deionized water was added on that sample and blank sample reagent was read by digestion tube. Reading was obtained by inserting digestion tube with sample. Finally, N% was calculated by using following formula [31].
Nitrogen (%) =
Where, V= Volume of HCL used for complete neutralization of NH3
N= Normality of HCL
Measurement of Potassium content was carried outby using Flame photometry method where 5 gm of soil sample was weighted and put on 300 ml beaker. This beaker was heated gently on electric furnace at 550˚C for about 4 hours to incinerate and was allowed to cool. 10 ml of hydrochloric acid and few water was added on it to make 20 ml. Beaker was covered with watch glass and allow to boil for 5 min. after standing to cool, transfer to a 500 ml volumetric flask. Again, water was added up to marked line. This was filtered with 3 filter papers to make the sample solution. For flame photometer, measurement condition was set up at analytical line wavelength of 766.5 nm. Potassium standard solution was sprayed for calibration curve preparation and the blank test solution for the calibration curve preparation into flame and value was read at a wavelength of 766.5. For sample measurement sample solution was transferred to a volumetric flask and 10 ml of interference suppressor solution was added and water up to marked line. Finally, Potassium content from the calibration curve was obtained and total potassium was calculated in the analytical sample [32]. Calculated data were analyzed using SPSS. Normality was checked for Carbon value of each plot of three different type of forests. Differences between mean of carbon stock value within each forest and between forests types was analyzed by using one-way ANOVA. Difference between variables of three different forests was analyzed by Tukey HSD test at 95% interval level. Descriptive analysis was also done to define standard deviation. Correlation test was done to find out the relation between different soils physicochemical characters.
- RESULT & DISCUSSION
Table 01: Average Carbon stock value of three different forests
| Forest type | AGC(t/ha) | BGC(t/ha) | Soil carbon(t/ha) | Total carbon(t/ha) |
| Schima-Castanopsis Forest | 126.06 | 25.68 | 80.49 | 232.24 |
| Oak-laurel Forest | 125.85 | 26.89 | 109.1 | 261.82 |
| Q. semicarpolia forest | 429.02 | 85.8 | 101.15 | 615.97 |
Table 02: Physico-chemical characteristics of soil (with± SD)
| Forest type | Soil type | BD(g/cm3)
|
Moisture % | OC% | N% | P (kg/ha) | K (kg/ha)
|
pH |
| Schima- Castanopsis | loam | 0.96±0.09 | 1.57±0.43 | 2.79±1.18 | 0.18±0.03 | 20.12±0.48 | 359.2±44.78 | 5.4±0.48 |
| Oak- laurel | loam | 1.04±0.07
|
3.27±1.29 | 3.48±1.70 | 0.18±0.02 | 24.72±0.49 | 359.2±0.23 | 4.93±0.51 |
| Q. semecarpifolia | loam | 0.98±0.14
|
3.42±1.90 | 3.41±0.82 | 1.1±0.12 | 26.78±0.03 | 495.8±4.28 | 5.19±0.02 |
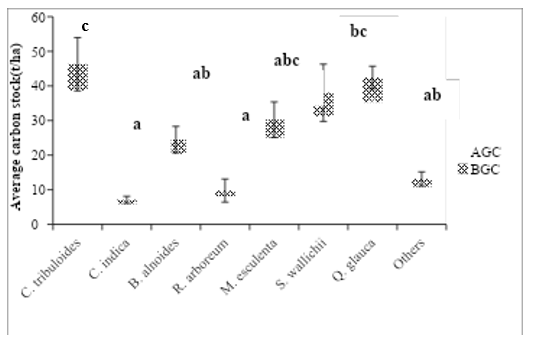
Figure 04: Average AGC and BGC (t/ha) of all investigated species in Schima-Castanopsis Forest (Error bars showed ±SD (N= 225). Different letter denotes the highly significant difference between the species tested by Duncan multiple range test at (P<0.05).
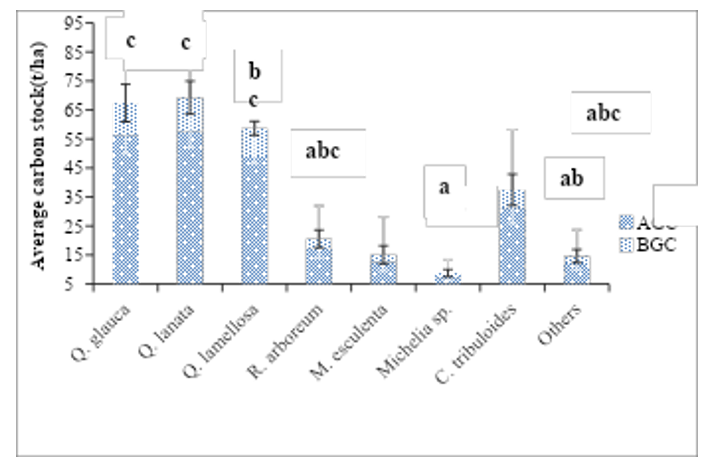
Figure 05: Average total carbon stock of AGC and BGC (t/ha) of all investigated species in Oak-laurel Forest (N=94). Different letter indicates the highly significant difference between the species tested by Duncan multiple range test at (P<0.05). Error bars showed ±SD (N=94).
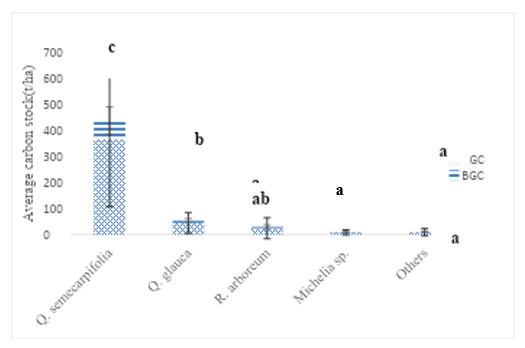
Figure 06: Average AGC and BGC (t/ha) of all investigated species in Q. semecarpifolia forest. Different letter denotes the highly significant difference between the species tested by Duncan multiple range test at (P<0.05). Error bars showed ±SD (N=66)
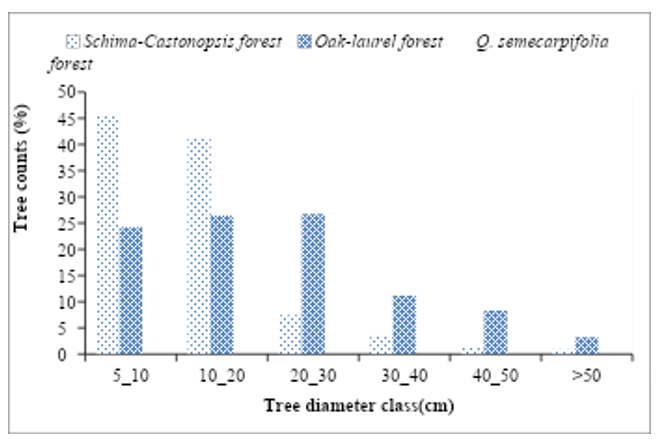
Figure 07: Diameter class distribution of trees at Phulchoki hill
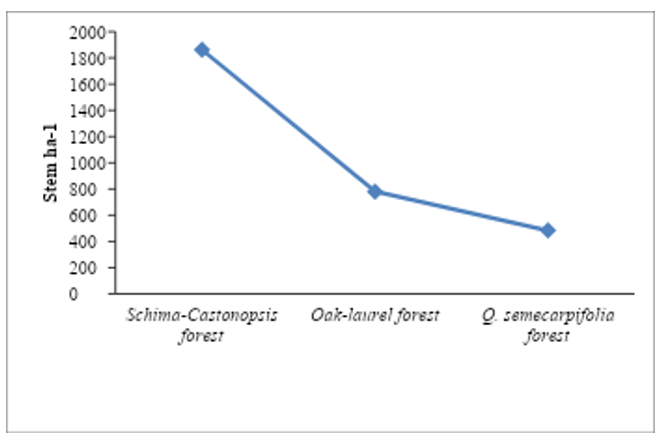
Figure 08: Density of all tree species in stem per hector with forest types
Six main types of disturbances were detected in my study sites namely forest fire, fodder collection, lopping, timber extraction, trampling and encroachment by road constructions etc. Schima-Castanopsis Forest was highly disturbed as it had high number of cut stumps, low coverage and there was very small tree size, Oak-laurel Forest was moderately disturbed and Q. semecarpifolia was least disturbed. Human disturbance was comparatively lower in the high-altitude region. Old age forest of Q. semecarpifolia has little disturbance due to falling of dead stem and insects. Forest fire affect was observed in Oak-laurel Forest at mid altitude. Road construction has caused removing of trees and landslide. Soil erosion is also common due to high sloppy mountain of Phulchowki Hill. Fodder collection, lopping and timber extraction has severely disturbed at lower altitude near human settlements. Green foliage of oak tree is used for fodder; fire is another driving factor of disturbance for making charcoal in mid altitude. Logging was also a most driving factor for disturbance.
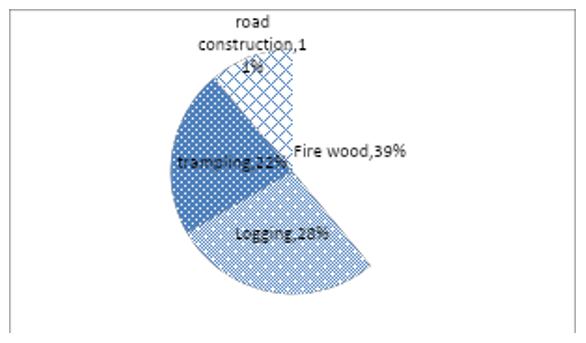
Figure 09: Drivers of disturbance and their intensity on Schima-Castanopsis Forest
There was highest disturbance in Schima-Castanopsis Forest. Total disturbance was supposed as 32.5% of total forest. It is situated in lower altitude and close to human settlements. In low altitude human, tourist, researchers and student’s movement is high. Similarly, Movements of local people are also higher for different purposes like collection of fire wood, fodder, etc. High disturbance was because of fire wood (39%) followed by logging (28%) and lowest due to road construction (11%) (Figure 10). Trampling was also seen as a major disturbance because people use sub roots to go top of Phulchowki Tower and recently there was constructing a new sub road by local government. Most of the trees were cut down during road construction.
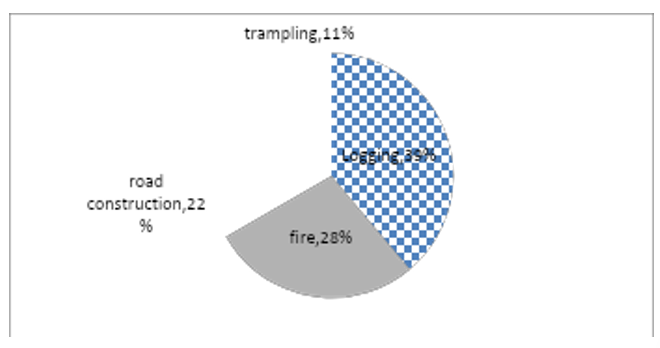
Figure 10: Drivers of disturbance and their intensity on Oak-laurel Forest
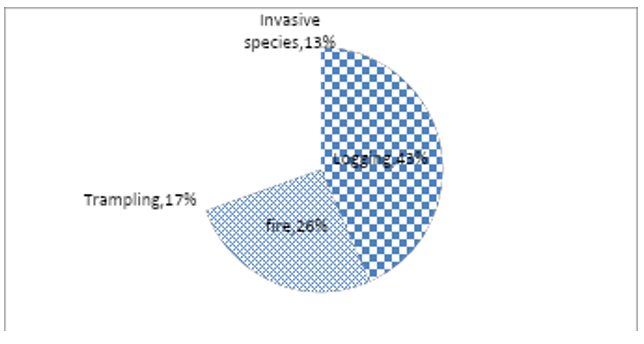
Figure 11: Drivers of disturbance and their intensity on Q. semecarpifolia forest
In Q. semecarpifolia forest there was only 2.3% disturbance (Fig 13) where major disturbance was logging (44%) followed by fire (26%), trampling (17%) and invasive species (13%) (Figure 12) were also causing major disturbance in this forest type. Invasive species like Ageratina denophora was observed in high altitude only in barren land near road side. Many trees are found dead with old age and insect attack.
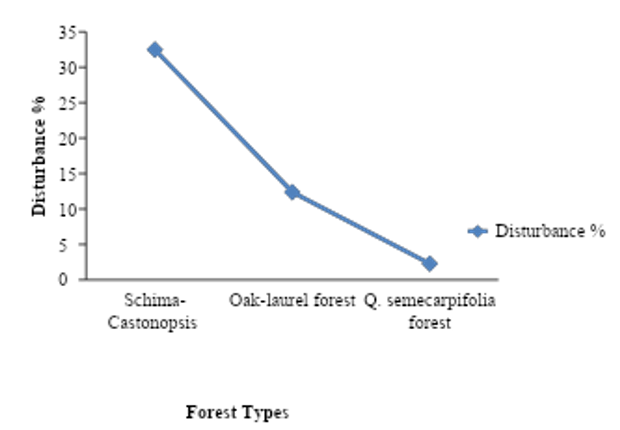
Figure 12: Total disturbance % of each forest
Disturbance % was highest in Schima-Castanopsis Forest (32.5%) among three forests which near to human settlements. Very low disturbance % was found in Q. semecarpifolia forest of high altitude (2.3%). Moderate disturbance (12.71%) was observed in Oak-laurel Forest of mid altitude (Figure 13). Significant impact of disturbance was observed on carbon value of heavily disturbed site. It was calculated that carbon stock in heavily disturbed site has 140.32 t/ha and moderately disturbed site has 230.43 t/ha, while carbon stock of undisturbed site has 426.76 t/ha (Fig 14). Tree density was highest in disturbed site (1862.36/ha) but with small size (5-10 cm DBH). Disturbance also altered the SOC of forest soil which also contributed in lowering total carbon stock. It was found that carbon stock in heavily disturbed site and moderately disturbed site has 286.49Ct/ha and 196.33Ct/ha less than undisturbed site, which is 67.11% and 46.04% less than undisturbed site respectively.
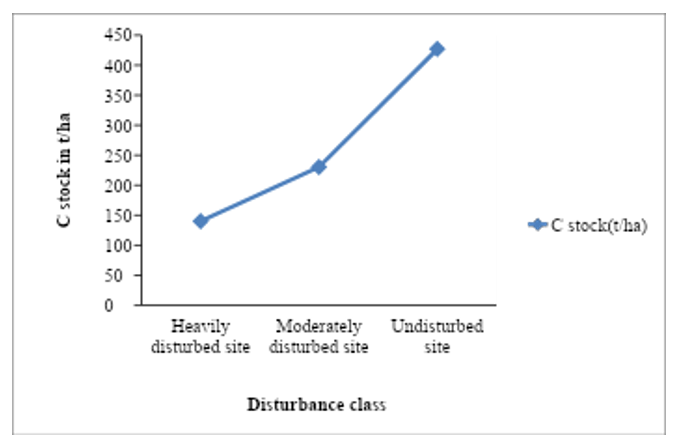
Figure 13: The quantity of carbon in three different forests at different level of disturbance
Minimum carbon stock value was estimated in Schima-Castonopsis Forest (38.5 t/ha) and maximum carbon stock value was estimated in Q. semecarpifolia forest (1398.53 t/ha). Descriptive analysis showed that std. deviation and Std. error was highest in Q. semecarpifolia forest (±302.90) and (±63.15) (Table 3) respectively as compared with other two forests which may be due to variation in DBH of the tree which ranged from 10cm – 108 cm.
Table 03: Descriptive analysis of Total tree carbon of Three Different Forests
| Forest types | Minimum | Maximum | MM mum Mean
|
95% Confidence Interval for
|
Std.
Deviation |
Std. Error | |
| Statistic | Statistic | Statistic | Lower
bound bounddd |
Upper
bound
|
Statistic | Statistic | |
| Schima-Castonopsis
forest |
38.5 | 491.57 | 151.75
|
115.9964 | 180.8515 | 94.40017 | 15.95654 |
| Oak-Laurel Forest | 54.53 | 303.18 | 152.76
|
123.8225 | 177.2995 | 71.60705 | 13.0736 |
| Q. Semecarpifolia forest | 76.5 | 1398.61 | 514.82
|
375.9836 | 637.955 | 302.9043 | 63.15992
|
Carbon stock value of both AGC and BGC of all three-forest type revealed highly significant difference when tested by One-way ANOVA at (P<0.05). The F value indicates the difference of carbon stock between the groups. Higher the F value more difference between the groups. F value of Q. semecarpifolia forest for both AGC and BGC (17.16 1nd 16.84) revealed that there was more difference between the groups as compared to other two forest (Table 4).
Table 04: One-way ANOA table of carbon stock of three different forests types
| Forest type
|
F value | P value
|
||
| AGC(t/ha)
|
BGC(t/ha) | AGC(t/ha) | BGC(t/ha) | |
| Schima-Castanopsis Forest | 6.552
|
6.582
|
0.000 | 0.000 |
| Oak-laurel Forest | 9.57
|
8.88
|
0.000 | 0.000 |
| Q. semecarpifolia forest | 17.16
|
16.841
|
0.000 | 0.000 |
Nitrogen attributed positive significant relationship with potassium (r =0.738) and clay content (r=.991). Similarly, Nitrogen showed significant relation with organic carbon (r= 0.418) and phosphorus (r= .738) while negative relation with bulk density (r= -0.277) and sand (r= 0-.698). Phosphorus revealed significant negative relation with sand, silt and ph. It revealed positive relation with clay, organic carbon and moisture. Potassium showed strong positive relation with clay particles (r=0.704) and organic carbon (r=0.418), while it revealed negative relation with others (Nitrogen, Phosphorous, pH, BD, sand and silt). Positive relation between organic carbon and clay content (r=0.373)) was observed. There was positive relation between pH and clay soil (r=0.111). Negative relations were observed between pH and bulk density, sand, silt and moisture (r<0). Negative relations were observed were not strongly significant at (P>0.05) (Table 5).
Table 05: Correlation analysis between soil particles.
| N% | P | K | pH | Moisture% | Organic carbon | Bulk density | Sand% | Silt% | Clay% | |
| N% | 1 | .738 | 1.000** | .061 | .562 | .418 | -.277 | -.698 | -.745 | .999* |
| P | 1 | .738 | -.628 | .973 | .921 | .443 | -.033 | -1.000** | .704 | |
| K | 1 | .061 | .562 | .418 | -.277 | -.698 | -.745 | .999* | ||
| pH | 1 | -.791 | -.881 | -.976 | -.757 | .620 | .111 | |||
| Moisture% | 1 | .986 | .639 | .200 | -.970 | .520 | ||||
| Organic carbon | 1 | .757 | .358 | -.918 | .373 | |||||
| Bulk density | 1 | .881 | -.434 | -.324 | ||||||
| Sand% | 1 | .042 | -.733 | |||||||
| Silt% | 1 | -.711 | ||||||||
| Clay% | 1 | |||||||||
| **. Correlation is significant at the 0.01 level (2-tailed). | ||||||||||
| *. Correlation is significant at the 0.05 level (2-tailed). | ||||||||||
DISCUSSION
Total carbon stock estimation was carried out in three different forests of Phulchoki areas from lower (1530m) to highest altitude (2600m). At the lower altitude Schima-Castonopsis Forest was found upto1800 m, Oak-laurel Forest was found between 1800- 2200 m and above 2200 m pure stand of Quercus semecarpifolia forest was found. In Q. semecarpifolia forest total carbon stock was found highest and lowest in Schima-Castonopsis Forest and intermediate was reported in Oak-laurel Forest. Similar study carried out by previous authors [33] in Shivapuri Nagarjun National Park. Highest carbon stock of oak forest was estimated by [34] in Salyan district (151,20 C mg ha-1) which is lower than present study. The biomass and carbon stock in forest varies, according to Geographical location, plant species and age of the stand [35]. Estimate of biomass contained within undisturbed forests are critical Aspects of determination of carbon loss associated with a wide range of land use and land cover changes processes. In Schima-Castonopsis Forest of the present study, there were highly significant difference of total carbon stock between species has been observed. Maximum mean value was recorded in C. tribuloides and minimum in C. indica. However, intermediate value was observed in associated species like Beta alnoides, Rhododendron arboreum, Myrica esculenta, Q. glauca etc. Similar results were observed by previous authors [36]. Total average carbon stock of schima-Casonopsis estimated in present study was highest than reported by [37] from Palpa district (175.19 t/ha). In my study, the number of associated species was less compared to the previous studies. One Way ANOVA showed that, there was highly significant difference between the species of Oak-laurel Forest of present study. Oak species like Q. glauca, Q. lanata and Q. lamellosa contributed highest carbon content as compared to other species. This result was supported by earlier authors [38,39]. The high carbon stock was may be due to large stem size, good forest structure and high wood specific density. Schima-Castonopsis Forest was found highly disturbed as compared to others two forest types in the present study area. This is because there was high human interaction in this forest. This forest is situated in very close to human settlements area. Godavari Park is also very close to this forest type. Many people are visiting this area for vacation, picnic, to watch snowfall during the winter. Phulchowki route is one of the important trekking spots for peoples from Kathmandu valley so every year many people travel at the top of Phulchowki area for vacation, trekking and for religious purpose etc. Local people use this forest for various purposes like fire wood, logging and collection of coal, and daily needs fruits, vegetables etc. Generally local people use forest product from the lower altitude so according to my results low altitudinal forest are highly disturbed than high altitudinal forest. The main drivers of disturbances were illegal logging, forest fire, encroachment, trampling in these forests. The illegal logging was major drivers of deforestation in these forests which was also supported by many studies [40,41]. Biomass depletion from logging activities comprises much more than the mere quantity of extracted timber. Most of the carbon losses come from felled trees that are abandoned in the forest, and trees incidentally damaged during felling. Aboveground and belowground biomass of the stump and crown left as deadwood, plus dead and damaged surrounding trees, can make up to 51% of the total carbon emissions in a harvesting activity [42]. The quantity of carbon sequestered varied among the forest fragments for the undisturbed, moderately and heavily disturbed sites. It was calculated that heavily disturbed site has 286.49 t/ha and moderately disturbed site has 196.33 t/ha or 67.11% and 46.04% less than undisturbed site respectively. Generally, forest disturbance altered the forest stand structure thereby influencing site-level carbon stocks and this is consistent with results reported in numerous studies [43,44]. In my study, Carbon stock value in heavily disturbed site was low as compared to least disturbed and undisturbed site. Low carbon stock in heavily disturbed site may be due to lower tree density, small tree size, small biomass of trees and also low regeneration. Forest biomass is highly affected by anthropogenic activities through changes in land use and forest management activities, and thus changing the natural greenhouse gas cycle [45]. Tree density was found to be decreased in present study from lower to higher altitude this pattern was also found by different researchers [46,47]. This may be due to decrease in temperature, rate of evapo-transpiration moisture etc. tree species density was found higher in Schima-castonopsis Forest which resembles with [48]. Soil organic carbon (SOC) depends upon various biotic and abiotic factors such as microclimate, faunal diversity, land use and management. Leaf litter, root litter and fire input play a major role in deposition of soil carbon [49]. Thus, there is an inter-relationship between vegetation and soil carbon dynamics in an ecosystem. In the present study SOC was determined from composite soil sample of three depth sizes (0-10cm, 10-20cm, 20-30cm). The soil carbon was highest in Oak-laurel Forest this may be due to high organic matter; more litters deposition as well, high burnt area in soil. Soil texture affects the size and turnover of soil microbial biomass [50], which ultimately affects the plant growth through the influence under water supply. Present study showed soil texture, soil types are more or less similar type. Similar results were observed by [51] in all forest types. However, contrast value was recorded by [52]. The finding of loamy texture at lower altitude and sandy loam at higher altitude was also reported by [52]. Soil pH varies among the forest types. In the present study, acidic soils were present, slightly low to high pH value of the soil was recorded in oak-laurel and Schima-Castanopsis Forest respectively. Contrast results were observed by [53] which showed pH value was reported decreasing trend with increasing elevation [54] were reported increase in pH of soil due to burned of vegetation and litter into ash. In the present study area moisture content (%) was highest in high altitudinal Q. semecarpifolia forest, lowest in low altitudinal Schima-Castanopsis Forest. Similar results were reported by [55]. Low moisture content in Schima-Castonopsis Forest may be due to open canopy and high litter collection. Similarly, high moisture content in Q. semecarpifolia forest was due to high litter deposition, large leaf size, dense canopy etc. High NPK content in Q. semecarpifolia forest and lowest in Schima-Castonopsis Forest were estimated. High value might be due to close tree canopy combined with dense forest with high accumulation of litter on the forest floor its input from the tree cover [56]. Correlation test for different soil for different soil parameters was done to find out the relation between each other. Pearson correlation revealed that different soil variables were significantly correlated with each other. A diverse range of correlation was recorded among different variables. The availability of nutrient for the plant is highly influenced by soil pH and it indicates soil fertility [57]. N% and K2O were highly positively correlated at 0.01 levels of significance. Similarly, N% and Clay particles were also highly correlated as significance value is 0.031. It showed that clay particles had high N%. Clay particles have high humus content, OM produced by litters accumulated in soil. N% and bulk density showed negative correlation this may be due clay soil have low bulk density but N% was high in clay soil. Similarly, N% was negatively correlated with moisture, sand and silt also. Phosphorus and silt particles were also highly correlate (p<0.05) which may be due to higher amount of hydrate oxides of Fe and Potassium and clay particles were also positively correlated which may be due to clay and humus particles develop negative electrical charge. It acquires negative correlation with BD, sand and silt. pH also acquired negative correlations with BD, sand and silt but all these negative correlations were not significant. Silt and Bulk density were positively correlated (P<0.05) which is also supported by [58]. Highest enzymatic activities in oak mixed soils are measures of high metabolic rate of viable soil microorganism which is considered as the reflection of high microbial activity and nutrient availability in this region. The enzymatic activity such as dehydrogenase together with basal respiration qco2 and MBC are the major parameters to influence metabolic ability and functional quantity of soil.
- CONCLUSION
Different scales of disturbance had altered the forest structure, reduced species diversity and decreased the capacity of the forest fragments to sequester carbon. Moderate and heavy forest disturbances resulted in low stand density compared to undisturbed sites within the same forest fragment. The capacity of the forest fragments to sequester atmospheric carbon was greatly reduced because of forest disturbances. Estimation of C stock of three different forest type of Phulchoki area along with disturbance class was carried out. Different soil parameters were also studied along altitudinal gradient also. Study site was observed to find out the intensity of disturbance and categorized with intensity of disturbance. Study concluded that Schima-Castonopsis Forest was heavily disturbed followed by Oak-laurel and Q. semecarpifolia forest. It was found that carbon stock was lower in heavily disturbed site followed by least disturbed and undisturbed site. Soil physicochemical properties showed that all forests site was slightly acidic. SOC was highest in Oak-laurel Forest followed by Q. semecarpifolia forest and Schima-Castonopsis Forest. Forest of lower altitude near human settlements had more disturbances that altered the capacity of forest to store carbon. Fire effect was observed in mid altitude of Oak-laurel Forest where people burnt tree to make coal. Encroachment due to road construction was also major drivers of forest degradation. Trampling and litter collection lowered the SOC of disturbed site at lower altitude. High slope had also lowered the soil organic matter due to run off of top soil in rainy season. Little numbers of Invasive species were also noticed along road side of Phulchowki tower which may be also serious problem in future for forest management. Forest soil was acidic and clay type of soil was found. Soil nitrogen, phosphorus and potassium was highest in Q. semecarpifolia forest as compared to other two forests. Organic carbon was highest in Oak-laurel Forest with as compared Q. semecarpifolia forest with and Schima-Castonopsis Forest.
REFERENCES
- Acharya, KP., Dangi R. 2011. Understanding forest Degradation in Nepal. Unasylva 238:
- Alexandrov, GA. 2007. Carbon Stock Growth in a Forest Stand: The Power of Age. Carbon Balance and Management 2(4): 1–5. http://dx.doi.org/10.1186/1750-0680-2-1.
- Aryal, C. 2010. Status of Carbon Stock at Toudol Chhap Community Forest, Sipadol, Bhaktapur. Master, Tribhuvan University, Kirtipur, Kathmandu, Nepal. pp 1-60.
- Bajracharya, A.M., B.K. Sitaula, B.M. Shrestha, K.D. Awasthi, M.K. Balla and B.A. Singh. 2004. Soil organic carbon status and dynamics in the Central Nepal middle mountains. Forestry (Journal of Institute of Forestry, Nepal), No. 12.
- Baral, S. K. et al. 1997. Above-ground carbon stock assessment in different forest types of Nepal’, 19(2).
- Baral, S., Malla, R. and Ranabhat, S. 1970. Above-ground carbon stock assessment in different forest types of Nepal’, Banko Janakari, 19(2), pp. 10–14.
- Boulmane, M., Santa-regina, M. C. and Halim, M. 2015. Organic Carbon Storage in Evergreen Oak Forest Ecosystems of the Middle and High Moroccan Atlas Areas’, (March), pp. 260–273.
- E. Law, D. Turner, J. Campbell, o. J. Sun, S.Vantuyl, W.D. Ritts and W.B. Cohen. 2004. Disturbance and Climate effects on carbon stocks and fluxes across western Oregon USA. Global change ecology (10), 1429-1444.
- Beatty SW. 1993. Study of soil properties along a hillslope in parson’s parcel bouldeb, co. Department of Geography University of Colorado Boulder.26.
- Carvell, K. L. & Tryon, E. H. 1961. The effect of environmental factors on the abundance of oak regeneration beneath mature oak stands. Forest Sci. 7: 98–105.
- Chave, J., Andalo, C., Brown, S., Cairns, M. A. Chambers, J. Q. and Eamus, D. 2005.Tree allometry and improved estimation of carbon stocks. Oecologia 145 (1): 87–99.
- Ch, N. et al. 2018. Physico-chemical characterization of Oak , Pine and Sal forest soil profiles of Betalghat Region of Kumaun Himalaya’, 7(3), pp. 261–272.
- Dahal, P. 2007. Carbon Sequestration status of Sunaulo Ghyampe Dada Community Forest, Kathmandu.
- Dar, J. A., Sundarapandian, S. and Res, F. 2013. Forest Research Soil Organic Carbon Stock Assessment in Two Temperate Forest Types of Western Himalaya of Jammu and Kashmir , India’, 3(1), pp. 1–5.
- De Andrade, R. B., Balch, J. K., Parsons, A. L., Armenteras, D., Roman-Cuesta, R. M., & Bulkan, J. 2017. Scenarios in tropical forest degradation: carbon stock trajectories for REDD. Carbon balance and management, 12(1),
- Dey SK. 2005. A preliminary estimation of carbon stock sequestrated through rubber (Hevea brasiliensis) plantation in North Eastern regional of India. Indian Forester 131(11):1429-1436.
- DFO, Monitoring and evaluation report of Community Forest Users’ Group. District Forest Office (DFO), Gulmi, Nepal; 89 pp.
- Gautam, R. S. 2019. Carbon Sequestration in the Trees of Community Forest : A Case Study of Hasantar Community Forest , Kathmandu , Nepal’, 7, pp. 124–129.
- Gautam, T. P., & Mandal, T. N. 2016. Effect of disturbance on biomass, production and carbon dynamics in moist tropical forest of eastern Nepal. Forest Ecosystems, 3 (1).
- Guo, L.B.; Gifford, R.M. 2002. Soil carbon stocks and land use change: a meta analysis. Global Change Biology 8(4): 345–360.
- Haq, Z. U. et al. 2017. Estimation of biomass and carbon stock of Quercus incana and their effect on insect population in Barawal valley of district upper Dir’, 5(3), pp. 13–17.
- Herrero, C. et al. 2012. Carbon Sequestration in Mediterranean Oak Forests’, pp. 1–26.
- Hill, S. 2004. Regeneration of Quercus semecarpifolia Sm . in’, (October 2017).
- Horwath WR. 2005. The importance of soil organic matter in the fertility of organic production systems, Western Nutrient Management Conference.
- IPCC, Special report on land use, land-use change and forestry. Intergovernmental Panel on Climate Change, Cambridge university press, Cambridge, UK.
- Jackson, ML., (1958). Soil chemical analysis. Prentice Hall, Englewood Cliffs.
- Karki, S., 1999. Ecological study of riverine forest in Koshi Tappu Wildlife Reserve (KTWR) [thesis]. Kathmandu: Central Department of Botany, Tribhuvan University. 56 p.
- Karki, S. et al. (2016) ‘Assessment of Forest Carbon Stock and Carbon Sequestration Rates at the ICIMOD Knowledge Park in Godavari, Nepal’, (November).
- C., Anup and Manandhar, R. 2014. Feasibility Analysis of Community Forestry Management in Syangja, Nepal. Tribhuvan University: Kathmandu.
- Lajtha, K., & Schlesinger, W. 1988. The Biogeochemistry of Phosphorus Cycling and Phosphorus Availability Along a Desert Soil Chronosequence (Vol. 69). pp. 24-39.
- Lal, R. 2001. Soil degradation by erosion. Land Degrad Develop 12 (6):519-539.
- Miller, C.E. 1965. Soil reaction and liming: soil fertility. John Wiley and Sons Inc. New York. pp. 436.
- Mishra, N. 2010 . Estimation of Carbon Stock at Chapako Community Forest, in Central Department of Environmental Sciences. Tribhuvan University: Kirtipur, Kathmandu,
- Nayak BP, Kohli P, Sharma JV. 2012. Livelihood of local communities and forest degradation in India: issues for REDD+. Ministry of Environment and Forests Government of India, New Delhi.
- Negi SS, Gupta MK, Sharma SD. 2013. Sequestered organic carbon pool in the forest soils of Uttarakhand State, India. International Journal of Science, Environment and Technology 2(3):510-520.
- Nowak, DJ., Greenfield EJ., Hoehn RE., Lapoint E. 2013. Carbon storage and sequestration by trees in urban and community areas of the United States. Environmental Pollution 178: 229–236.
- Oli, B. N. and Shrestha, K. 2009. Carbon Status in Forests of Nepal : An Overview’, Journal of Forest and Livelihood, 8(1), pp. 62–67.
- Olsen S, Watanabe FS, Bowman RA. 1983. Evaluation of fertilizer phosphate residues by plant uptake and extractable phosphorus. Soil Science 47:952–958.
- Panthi, B.B. 2012. Additional benefits of community managed forest; A case study of Champadevi community forest. Nepal journal of science and technology,(12), 127-132.
- Post, W.M.; Kwon, K.C. 2000. Soil carbon sequestration and land-use change: processes and potential. Global Change Biology 6(3): 317–327.
- Poudyal, K. 2013. Maintenance of turgor in response to drought in Schima Wallichii and Quercus Semecarpifolia at Phulchoki Hill, Kathmandu, Nepal. Journal of Biological and Scientific Opinion. 1(3):145-150]
- Powers MD, Kolka RK, Bradford JB, Palik BJ, Fraver S, Jurgensen MF. 2012. Carbon stocks across a chronosequence of thinned and unmanaged red pine (Pinus resinosa) stands. Ecolog Applicat 22: 1297–1307.
- Press JR, KK Shrestha and DA Sutton. 2000. Annotated Checklist of Flowering Plants of Nepal. The Natural History Museum, London.
- Rana, B. S., Singh, R. P. and Singh, S. P. 1989. Carbon and energy dynamics of seven Central Himalayan forests”, Tropical Ecology, 30, 2, , pp. 253–264.
- Rossi, S., A. Deslauriers, T. Anfodillo and V. Carraro. 2007. Evidence of threshold temperatures for xylogenesis in conifers at high altitudes. Oecologia, 152(1): 1-12.
- Shaheen, H., Khan, A. Hussain, K., Ullah, T.S., Nasir, M. and Mehmood, A. 2016 . Carbon stocks assessment in subtropical forest types of Kashmir Himalayas. Pak. J. Bot., 48(6): 2351-2357.
- Sharma, BK., Pokhrel, CP., Shrestha, LJ. 2015. Forests diversity and carbon sequestration in resunga grove, Gulmi, Nepal. Journal of Nat. hist.Mus. (19): (60-69).
- Shrestha, A. 1992. Physical and chemical properties of soil in Nepal. J For Inf Nep 3(4): 27- 29
- Shrestha, B. M. and Shing, B R. 2007. Soil and vegetation carbon pools in a mountainous watershed of Nepal, Springer Science. Journal Nutrient cycling in agro ecosystem. 81:179–191.
- Shrestha, B. P. 1970. Carbon Sequestration in Broad Leaved Forests of Mid-Hills of Nepal: A Case Study from Palpa District. The Initiation, 3(C), pp. 20–29.
- Shrestha, B. P. 2008. An analytical study of carbon sequestration in three different forest types of mid hills of Nepal. A Master thesis submitted to Tribhuwan University, Institute of forestry, Pokhara, Nepal.
- Shrestha, B. P. 2009. Carbon Sequestration in Broad Leaved Forests of Mid-Hills of Nepal: A Case Study from Palpa District. The Initiation, 3, 20-29.
- Shrestha, B. P. 2015. Carbon Sequestration in Schima-Castanopsis Forests Car rbon Sequ estration in Schima-Castanopsis Forest : C Study y from Palp pa District A Case’, (August).
- Shrestha, B. P. and Devkota, B. P. 2016. Carbon stocks in the Oak and Pine Forests in Salyan District, Nepal’, Banko Janakari, 23(2), pp. 30–36.
- Singh, J. and S. Singh. 1987. Forest vegetation of the Himalaya. The Botanical Review, 53(1): 80-192.
- Thomas, C. D., Cameron, A., Green, R. E., Bakkenes, M., Beaumont, L. J., Collingham, Y. C., Williams, S. E. 2004. Extinction risk from climate change. Nature, 427, 145.
- Vetaas, O.R. 2000. The effects of environmental factors on the regeneration of Q. semecarpifolia Sm. in central Himalaya, Nepal. Pl. Ecol. 146: 137 – 144.
- Zobel DD, PK Jha, MJ Behan and UKR Yadav. 1987. A Practical Manual for Ecology. Ratna Pustak Distributors, Kathmandu, Nepal.
Publication History
Submitted: October 25, 2024
Accepted: November 22, 2024
Published: April 31, 2025
Identification
D-0583
DOI
https://doi.org/10.71017/djnsi.4.4.d-0583
Citation
Govinda Prasad Khanal , Kanta Poudyal & Biva Aryal (2025). Effect Of Anthropogenic Effect on the Carbon Stock of Forest in PHULCHOKI Hill. Dinkum Journal of Natural & Scientific Innovations, 4(04):229-246.
Copyright
© 2025 The Author(s).