

")
Publication History
Submitted: March 17, 2025
Accepted: March 30, 2025
Published: March 31, 2025
Identification
D-0441
DOI
https://doi.org/10.71017/djsi.4.03.d-0441
Citation
Rose Anne I. Capadeso & Quindhe M. Banquiao (2025). Factors Influencing Language Proficiency Among Grade 12 Learners in Relation to Their Performance. Dinkum Journal of Social Innovations, 4(03):141-157.
Copyright
© 2025 The Author(s).
141-157
Factors Influencing Language Proficiency Among Grade 12 Learners in Relation to Their PerformanceOriginal Article
Rose Anne I. Capadeso 1*, Quindhe M. Banquiao 2
- Teacher III – DepEd Zamboanga del Norte, Philippines.
- Professor, Jose Rizal Memorial State University, Zamboanga del Norte, Philippines.
* Correspondence: capadesoroseanne@gmail.com
Abstract: English proficiency is crucial in today’s globalized world, but many students still face difficulties in using the language effectively. The Division of Zamboanga del Norte has released a Memorandum No. 360 Series of 2023 requiring teaching and non-teaching staff to speak English as a medium of communication. This study investigated the relationship between factors influencing language proficiency, specifically speaking and writing, and the English performance of Grade 12 senior high school learners at Polanco National High School for the 2024-2025 school year. The study is based on Lev Vygotsky’s Sociocultural Cognitive Development Theory, which suggests that a child’s cognitive development and learning ability can be guided and mediated by their social interactions. The study used a survey questionnaire to assess English proficiency among Grade 12 senior high school students, analyzing 187 respondents, with 69.52% being 17 years old. The findings are influenced by the high representation of HUMSS students (53.48%), indicating a strong focus on humanities and social sciences. Attitudes towards the English language significantly influence language proficiency, with factors like motivation, enjoyment, and confidence contributing to proficiency. Students demonstrate satisfactory English proficiency, with strong grammar, fluency, pronunciation, and accuracy in speaking skills, but needed growth in vocabulary and comprehensibility in writing. The study concluded that attitudes and perceptions play a crucial role in shaping students’ language proficiency, emphasizing the importance of a positive mindset. The findings underscore the need for targeted instructional strategies that foster language development, suggesting that teachers and student organizations can improve English language learning by creating engaging activities, incorporating vocabulary-building activities, and providing continuous professional development for teachers.
Keywords: English language, Teachers, learners, writing, English proficiency
- INTRODUCTION
English proficiency is vital in today’s globalized world, serving as a gateway to higher education, career advancement, and effective communication. Despite its recognized importance and official use in countries like the Philippines, many students continue to struggle with mastering the language. Declining scores in EF English Proficiency Index, TOEIC, and IELTS reflect this concern, prompting initiatives such as Memorandum No. 360 Series of 2023 in Zamboanga del Norte, which mandates the use of English in schools. Still, learners face barriers like language anxiety, cultural stereotypes, and lack of supportive environments. Grounded in Vygotsky’s Sociocultural Cognitive Development Theory, which emphasizes the role of social interaction and cultural context in learning, this study explored the relationship between factors influencing English proficiency—particularly speaking and writing—and the performance of Grade 12 learners at Polanco National High School for the 2024–2025 school year. Complementary theories, including Krashen’s Affective Filter Hypothesis, Bourdieu’s Cultural Capital Theory, and Cummins’ BICS-CALP distinction, further highlight how confidence, culture, and depth of language use shape learning outcomes. The study examined students’ profiles, such as age, sex, and academic strand, and tested two hypotheses: whether factors influencing language proficiency differ by profile, and whether these factors significantly affect English performance. Using rubrics to objectively assess speaking and writing skills, the research identified key influences from attitudes, anxiety, parents, peers, and teachers. Results are expected to provide insights for students, teachers, administrators, parents, and future researchers in developing strategies to improve proficiency. Ultimately, addressing language anxiety, fostering positive attitudes, and creating supportive learning environments can help learners strengthen both communication and academic performance.
- MATERIALS AND METHODS
This study focuses on the English proficiency of senior high school students at Polanco National High School, a part of the Philippine Education System under the K-12 program. The study used a quantitative method with descriptive-correlational design to determine the factors affecting English proficiency. The study was conducted at Polanco National High School, which caters to students enrolled in various academic strands, including the Technical-Vocational-Livelihood track. The study found that many students struggle with speaking and writing English, indicating a persistent decline in their proficiency. The study aimed to identify the factors influencing students’ language proficiency and offer insights to enhance their speaking and writing abilities. The respondents were Grade 12 senior high school students enrolled for the 2024-2025 school year, with a total population of 347.
Table 01: Distribution of Respondents
| Strand | Population | Sample | Respondents | Percentage |
| HUMSS | 185 | 100 | 100 | 54% |
| ABM | 23 | 12 | 12 | 6% |
| STEM | 57 | 31 | 31 | 17% |
| TVL | 82 | 44 | 44 | 24% |
| Total | 347 | 187 | 187 | 100% |
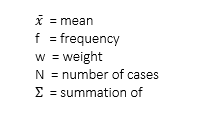
The study used a survey questionnaire to gather data on English proficiency among Grade 12 senior high school students. The questionnaire, adopted from [2] study, identifies six factors affecting English proficiency: language anxiety, cultural stereotypes, attitudes, parental, peer, and teacher influences. The questionnaire was used to measure students’ speaking and writing proficiency. Students were asked to answer questions about their stance on senior high school implementation, English importance, and fear of making mistakes in English. The level of proficiency in speaking was assessed using a rubric from [3] and [4]. The rubric included aspects such as grammar, vocabulary, comprehensibility, fluency, pronunciation, and accuracy. The study received approval from the school principal, university, and ethics committee before data collection. A consent letter was given to participants to provide relevant information. The structured survey questionnaire was distributed to respondents, and the researcher personally guided them to clarify aspects that needed further explanation. The study used rubrics for both speaking and writing assessments to ensure an objective and standardized evaluation. After collecting the data, results were tallied in MS Excel. Statistical tools to be used were the weighted mean and Pearson r correlation. Frequency Count and Percentage. This was used to determine the profile of the participants in terms of gender, and parental education. The formula is:
![]()
N
Where:
P (%) = percentage
F = frequency
N = total number of participants
Mean. This was used to measure how spread the scores of the participants are. The formula is:

Where:
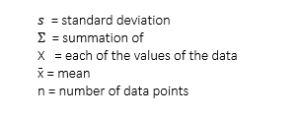
Standard Deviation. This was used to describe the English language proficiency of senior high school learners under study. The formula is:
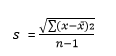
Where:
The study received approval from the School Principal, Division Office, and University’s Ethics Committee, obtaining informed consent from participants, maintaining confidentiality and anonymity, and upholding data integrity by accurately reporting findings and securely handling collected data.
- RESULTS AND DISCUSSION
This study analyzed the age distribution of 187 respondents, revealing a significant majority of them being 17 years old. The majority, 69.52%, are 17 years old, indicating a specific focus or relevance of the study. The other age categories, including 18-year-olds, 16, 19, and 20-year-olds, have lower representation. The high representation of 17-year-olds provides valuable insights into their behaviors, attitudes, and needs. This demographic plays a crucial role in the study, as it is at a critical point in their academic development, particularly in language proficiency, as they prepare for higher education or employment opportunities.
Table 02: Profile of Respondents in terms of Age
| Categories | F | P |
| 16 years | 15 | 8.02% |
| 17 years | 130 | 69.52% |
| 18 years | 24 | 12.83% |
| 19 years | 12 | 6.42% |
| 20 years | 6 | 3.21% |
| Total | 187 | 100% |
Table 3 shows a gender imbalance in a study with 187 respondents, with 41.18% male and 58.82% female. This could affect the findings and conclusions, especially if gender differences are relevant to the study’s focus. Understanding this imbalance is crucial for interpreting data and ensuring the generalizability of findings. Future studies should aim for more equitable representation to provide a more holistic understanding of the issues being investigated.
Table 03: Profile of Respondents in terms of Sex
| Categories | F | P |
| Male | 77 | 41.18% |
| Female | 110 | 58.82% |
| TOTAL | 187 | 100% |
The study’s findings are influenced by the high representation of HUMSS students (53.48%), indicating a strong focus on students in humanities and social sciences. The underrepresentation of the ABM strand suggests that the interests and insights of these students may not be adequately captured. The high proportion of HUMSS respondents significantly influences the findings and implications of the research, as seen in [5] study on students’ preferences in senior high school.
Table 04: Profile of Respondents in terms of Strand
| Categories | F | P |
| HUMSS | 100 | 53.48% |
| ABM | 12 | 6.42% |
| STEM | 31 | 16.58% |
| TVL | 44 | 23.53% |
| TOTAL | 187 | 100% |
Table 5 shows the average weighted value and descriptors of factors influencing language proficiency, focusing on language anxiety. The data indicates that while language anxiety is a relevant factor, there may be other dominant factors at play. Understanding these nuances can help educators and researchers develop targeted strategies to support learners in overcoming language anxiety. The impact of language anxiety varies across different factors, with Item 4 standing out as particularly influential. Teachers can design curricula and classroom activities that address factors contributing to language anxiety, such as confidence-building exercises and stress-reduction techniques. Teacher training programs can equip teachers to identify and mitigate language anxiety, ensuring more effective teaching practices. Understanding and mitigating language anxiety can enhance learners’ overall language proficiency and learning experiences.
Table 05: Factors influencing Language Proficiency along Language Anxiety
| Items | AWV | D |
| 1. I feel anxious to speak English.* | 3.09 | Sometimes |
| 2. I encourage myself to speak English even when I am afraid to speak. | 3.18 | Sometimes |
| 3. I fear of negative evaluation by people with higher proficiency in English.* | 3.15 | Sometimes |
| 4. I fear of making grammatical mistake during conversation.* | 3.54 | Often |
| 5. I don’t have wide vocabulary to speak in English.* | 3.14 | Sometimes |
| 6. I find it hard to translate my native language to English during speaking.* | 3.22 | Sometimes |
| Mean | 3.22 | Sometimes |
The table shows that cultural stereotypes have a moderate influence on language proficiency, with respondents acknowledging their influence to a moderate degree. These stereotypes can shape learners’ attitudes and experiences in language acquisition, and understanding them is crucial for educators and language programs. Addressing cultural stereotypes in language learning is essential for fostering an inclusive environment. Teachers should be equipped to recognize and mitigate the subtle impacts of stereotypes on learners’ confidence and attitudes. Professional development programs can provide strategies to create supportive, bias-free classrooms. Language programs should incorporate activities that encourage intercultural collaboration and understanding, empower learners, and critically examine stereotypes. Future research should explore the dynamics of these stereotypes and their varying impacts.
Table 06: Factors influencing Language Proficiency along Cultural stereotypes
| Items | AWV | D |
| 1. My Society viewed those who can speak English as an outcast.* | 3.02 | Sometimes |
| 2. I feel ‘less Filipino’ when I speak English.* | 3.15 | Sometimes |
| 3. My society marked those with higher proficiency in English as well-educated. | 3.32 | Sometimes |
| 4. My society valued those who can speak their own language rather than foreign language. | 3.28 | Sometimes |
| Mean | 3.19 | Sometimes |
The study revealed that attitudes and perceptions towards the English language significantly impact language proficiency. High mean values across all items indicate that respondents believe their attitudes significantly impact their ability to learn and use the language. Factors such as motivation, enjoyment, and confidence contribute to language proficiency. The overall mean score is 3.80, indicating a strong correlation between mindset and language skills. This highlights the importance of fostering positive attitudes in educational settings to enhance language learning experiences. Teachers can leverage this correlation by promoting motivational strategies, enjoyable learning activities, and confidence-building exercises.
Table 07: Factors influencing Language Proficiency along Attitudes and Perceptions towards English language
| Items | AWV | D |
| 1. I have desire to learn good English. | 3.95 | Often |
| 2. I would read English materials as often as I could. (newspaper/magazines/books) | 3.89 | Often |
| 3. I pay attention when someone is speaking in English. | 3.75 | Often |
| 4. I believe English is the mark of an educated person. | 3.92 | Often |
| 5. I believe that being good in English will help me in my future career. | 3.70 | Often |
| 6. I believe English should be used as a medium of instruction in the Philippines. | 3.59 | Often |
| Mean | 3.80 | Often |
The data in table 8 shows that respondents generally feel that parental factors do not significantly impact their language learning experiences. The overall mean score is 2.45, indicating that parental involvement or support are not frequently recognized as impactful. This suggests a need for greater parental involvement in the language learning process or a shift in focus to other influences. However, increased parental involvement can influence children’s language acquisition and proficiency, suggesting that teachers should actively involve parents through workshops or communication strategies to enhance students’ language learning experiences.
Table 08: Factors influencing Language Proficiency along Parental influence
| Items | AWV | D |
| 1. My parents speak English to the family. | 2.52 | Rarely |
| 2. My parents encourage me to speak English. | 2.47 | Rarely |
| 3. My parents often watch the English channels on TV. | 2.40 | Rarely |
| 4. My parents don’t think that being good in English means I have become ‘westernized’. | 2.35 | Rarely |
| 5. My parents have friends of various races and encourage me to befriend with other races as well. | 2.49 | Rarely |
| Mean | 2.45 | Rarely |
The data in table 9 shows that peer factors influence language proficiency to a moderate extent, with most items falling into the “sometimes” category. However, their influence may not be consistently strong across all aspects. The overall mean score is 2.94, indicating that respondents recognize the influence of their peers on language proficiency to a moderate extent. This suggests that fostering collaborative environments and peer support in language learning contexts could be beneficial. Encouraging group work and peer-to-peer interactions could enhance language proficiency among learners.
Table 09: Factors influencing Language Proficiency along Peer influence
| Items | AWV | D |
| 1. I have many friends who speak English. | 3.15 | Sometimes |
| 2. My friends are encouraging when I speak English. | 2.89 | Sometimes |
| 3. My friends and I seldom buy English books or magazines. | 2.58 | Sometimes |
| 4. My friends and I often use English outside the classroom. | 3.01 | Sometimes |
| 5. My friends and I find that English is as important as our native language. | 3.07 | Sometimes |
| Mean | 2.94 | Sometimes |
The data shows that teachers have a moderate influence on language proficiency, with scores ranging from 3.15 to 3.40. However, the influence is not overwhelmingly strong, with teacher interactions and instructional methods being considered relevant. The study highlights the importance of effective teaching in language education and suggests opportunities for enhancing instructional practices. To optimize teacher influence, professional development programs should focus on innovative and evidence-based language teaching strategies, such as differentiated instruction, active learning techniques, and culturally responsive pedagogy. Feedback mechanisms, student surveys, and collaboration among educators through peer learning communities can guide teachers in tailoring their approaches to maximize engagement and proficiency. By prioritizing these actions, language programs can leverage teacher influence to significantly enhance language proficiency among students.
Table 10: Factors influencing Language Proficiency along Teacher influence
| Items | AWV | D |
| 1. My lectures speak in English all the time. | 3.15 | Sometimes |
| 2. My lectures make learning English fun. | 3.40 | Sometimes |
| 3. My lectures translate from English to my native language to ensure my understanding. | 3.36 | Sometimes |
| 4. My lectures motivate me to use English outside classroom too. | 3.38 | Sometimes |
| Mean | 3.32 | Sometimes |
The data in table 11 reveals that various factors influence language proficiency, with language anxiety, cultural stereotypes, and attitudes playing varying degrees of influence. Positive attitudes are crucial for language learners, while anxiety, cultural perceptions, and teacher effectiveness also play important roles. Parental involvement is perceived as having minimal impact on language learning, while peer influence is moderate. Teachers are viewed as having a moderate influence on language proficiency, but may need further improvement. On average, these factors have a moderate influence on language proficiency. Strategies to enhance language education can focus on attitude development, improving teaching practices, and potentially increasing parental engagement. Teachers can implement activities and programs that cultivate a positive attitude towards language learning, such as engaging, interactive lessons, and integrating innovative teaching methods. Fostering communication and collaboration with parents can also reinforce language skills.
Table 11: Summary on the Factors influencing the Language Proficiency
| Indicators | Mean | D |
| Language Anxiety | 3.22 | Sometimes |
| Cultural Stereotype | 3.19 | Sometimes |
| Attitudes and Perceptions towards English Language | 3.80 | Often |
| Parental Influence | 2.45 | Rarely |
| Peer Influence | 2.94 | Sometimes |
| Teacher Influence | 3.32 | Sometimes |
| Grand Mean | 3.15 | Sometimes |
Table 12 shows a breakdown of students’ speaking skills and grammar proficiency. The majority of students are very satisfactory, with a small percentage of outstanding students. The majority of students are in the very satisfactory category, with over half of the respondents rated as very satisfactory. However, there is room for improvement in grammar usage. A small percentage of students are in the fair category, with some challenges in grammar usage. The smallest group is in the poor category, with significant difficulties in grammar. The data suggests that grammatical proficiency influences interactional competence and overall speaking skills. Teachers should implement differentiated instruction, using diagnostic assessments, interactive activities, technology, and regular feedback to help students improve their grammar skills and interactional competence.
Table 12: Students speaking skills along Grammar
| Categories | F | P | X | D |
| Outstanding | 27 | 14.44% | ||
| Very satisfactory | 95 | 50.50% | ||
| Satisfactory | 46 | 24.60% | 3.69 | Very Satisfactory |
| Fair | 17 | 9.09% | ||
| Poor | 2 | 1.07% | ||
| Total | 187 | 100% |
Table 13 shows students’ vocabulary proficiency in relation to their speaking skills. Outstanding vocabulary skills are present in 14.44% of students, while very satisfactory vocabulary skills are present in 39.04% of students. Satisfactory vocabulary skills are present in 33.15% of students, but may require further development. Fair vocabulary skills are present in 1.76% of students, while poor vocabulary skills are present in 1.60% of students. The data suggests a diverse range of vocabulary proficiency levels among students, highlighting the need for targeted instructional strategies to improve vocabulary acquisition and application in speaking contexts. Teachers can address vocabulary gaps by implementing targeted vocabulary-building strategies, using technology-based tools, and integrating context-based vocabulary instruction into lessons. This approach can enhance students’ speaking performance and overall language proficiency.
Table 13: Students speaking skills along Vocabulary
| Categories | F | P | MEAN | D |
| Outstanding | 27 | 14.44% | ||
| Very satisfactory | 73 | 39.04% | ||
| Satisfactory | 62 | 33.15% | 3.53 | Very Satisfactory |
| Fair | 22 | 11.15% | ||
| Poor | 3 | 1.60% | ||
| Total | 187 | 100% |
Table 14 shows students’ speaking skills in terms of comprehensibility. The majority of students are very satisfactory (43.32%), followed by 29.95% (25.60), outstanding (13.90%), fair (11.76%), and poor (1.07%). These categories indicate a solid level of proficiency in comprehensibility. However, a notable percentage still require support. Emphasizing the skills of students in these categories is essential for fostering better communication abilities. The data supports the importance of comprehensibility in effective communication and language proficiency, and can guide instructional strategies to improve comprehensibility among all students.
Table 14: Students speaking skills along Comprehensibility
| Categories | F | P | MEAN | D |
| Outstanding | 26 | 13.90% | ||
| Very satisfactory | 81 | 43.32% | ||
| Satisfactory | 56 | 29.95% | 3.58 | Very Satisfactory |
| Fair | 22 | 11.76% | ||
| Poor | 2 | 1.07% | ||
| Total | 187 | 100% |
Table 15 shows students’ speaking skills based on fluency. The largest group is very satisfactory, with 38.50% of students exhibiting very satisfactory speaking skills. The second group is satisfactory, with 29.41% having a good grasp but not engaging as frequently or effectively. The third group is outstanding, with 21.39% showing excellent speaking skills. The fourth group is fair, with 9.63% experiencing challenges with frequency, and the fifth group is poor, with 1.07% experiencing significant difficulties. The data suggests a need for targeted support to improve students’ speaking skills. Task-based instruction can help enhance fluency and overall language skills.
Table 15: Students speaking skills in terms of Fluency
| Categories | F | P | MEAN | D |
| Outstanding | 40 | 21.39% | ||
| Very satisfactory | 72 | 38.50% | ||
| Satisfactory | 55 | 29.41% | 3.69 | Very Satisfactory |
| Fair | 18 | 9.63% | ||
| Poor | 2 | 1.07% | ||
| Total | 187 | 100% |
The data in table 16 shows that a majority of students demonstrate satisfactory to outstanding accuracy in their speaking skills, with a mean score of 36.90%. However, a smaller percentage struggle with accuracy, possibly due to issues with grammar, vocabulary usage, or fluency. The smallest group, 1.07%, also shows significant difficulties with accuracy, indicating a need for targeted interventions. The study suggested that while a majority of students demonstrate satisfactory to outstanding accuracy, a smaller percentage still requires support to improve their speaking skills. To improve language proficiency, teachers should implement targeted instructional strategies, such as explicit grammar instruction, error analysis, and corrective feedback, interactive speaking activities, and personalized support.
Table 16: Students speaking skills along Accuracy
| Categories | F | P | MEAN | D |
| Outstanding | 39 | 20.86% | ||
| Very satisfactory | 69 | 36.90% | ||
| Satisfactory | 61 | 32.62% | 3.68 | Very Satisfactory |
| Fair | 16 | 8.56% | ||
| Poor | 2 | 1.07% | ||
| Total | 187 | 100% |
The data table 17 shows that a significant proportion of students demonstrate strong pronunciation skills, with a mean score of 3.79 classified as very satisfactory. However, there is still room for improvement in these students. The data suggests that teachers should implement strategies to enhance pronunciation through activities such as phonetic exercises, listening drills, and peer feedback. While many students demonstrate strong pronunciation skills, a significant number still require support to improve their speaking clarity. Practical implications include incorporating targeted pronunciation exercises into the curriculum, leveraging technology to provide immediate feedback on pronunciation accuracy, and integrating listening activities to expose students to native or fluent speakers. By prioritizing these strategies, teachers can enhance students’ overall speaking proficiency and confidence.
Table 17: Students speaking skills along Pronunciation
| Categories | F | P | MEAN | D |
| Outstanding | 40 | 21.39% | ||
| Very satisfactory | 86 | 45.99% | ||
| Satisfactory | 44 | 23.53% | 3.79 | Very Satisfactory |
| Fair | 15 | 8.02% | ||
| Poor | 2 | 1.07% | ||
| Total | 187 | 100% |
The study revealed that students demonstrate satisfactory proficiency in various aspects of their speaking skills, including grammar, vocabulary, comprehensibility, fluency, pronunciation, and accuracy. Grammar received a mean score of 3.69, indicating correct sentence construction and appropriate grammatical structures. Vocabulary had a mean of 3.53, indicating a reasonable range of vocabulary. Comprehensibility had a mean of 3.58, indicating effective communication but occasional issues. Fluency had a mean of 3.69, indicating good flow and confidence. Pronunciation had a mean score of 3.79, indicating clear and accurate language. Accuracy had a mean score of 3.68. However, common grammar flaws were identified, suggesting areas for improvement. Teachers can address these issues through targeted grammar exercises and structured writing practice. Technology can provide personalized practice and feedback, while fostering a communicative classroom environment through collaborative activities and peer feedback can enhance confidence and proficiency. Formative assessments can monitor progress and tailor instruction to individual needs.
Table 18: Summary on Students’ Speaking Skills
| Categories | MEAN | D |
| Grammar | 3.69 | Very Satisfactory |
| Vocabulary | 3.53 | Very Satisfactory |
| Comprehensibility | 3.58 | Very Satisfactory |
| Fluency | 3.69 | Very Satisfactory |
| Pronunciation | 3.79 | Very Satisfactory |
| Accuracy | 3.68 | Very Satisfactory |
| Grand mean | 3.66 | Very Satisfactory |
Table 19 shows that a majority of students demonstrate exceptional authenticity in their writing, with 84.90% falling into the outstanding category. This indicates they can produce original, genuine work that reflects their unique voice and understanding of the subject matter. The very satisfactory category has strong performance, with 20.32% of students showing some limitations. The satisfactory category has 8.56% of students with a mean score of 4.25, indicating a solid level of authenticity. The fair category has 3.21% of students struggling to produce authentic writing, possibly due to reliance on clichés or lack of personal engagement. The poor category has 0.53% of students with significant challenges.
Table 19: Students writing skills in terms of Authenticity
| Categories | F | P | MEAN | D |
| Outstanding | 126 | 84.90% | ||
| Very satisfactory | 38 | 20.32% | ||
| Satisfactory | 16 | 8.56% | 4.25 | Outstanding |
| Fair | 6 | 3.21% | ||
| Poor | 1 | .53% | ||
| Total | 187 | 100% |
Table 20 shows that a majority of students demonstrate outstanding writing skills in aligning their content with the title. Out of 129 students, 68.98% are outstanding, indicating strong focus and relevance. The remaining students are very satisfactory, with 18.18% adhering to the title’s focus. The third group, 6.95%, has a satisfactory performance, while a small number struggle with content alignment. The last group, 0.53%, has significant difficulties with content alignment, indicating a need for targeted support. The data suggests that content organization and development are crucial for improving students’ writing skills. However, attention should be given to the small number of struggling students to ensure they receive necessary support.
Table 20: Students writing skills along Content in accordance with the title
| Categories | F | P | MEAN | D |
| Outstanding | 129 | 68.98% | ||
| Very satisfactory | 34 | 18.18% | ||
| Satisfactory | 13 | 6.95% | 4.55 | Outstanding |
| Fair | 10 | 5.35% | ||
| Poor | 1 | .53% | ||
| Total | 187 | 100% |
The data shows that 33.64% of student’s exhibit outstanding text harmony, indicating effective organization and logical progression. The majority of students, 41.71%, demonstrate very satisfactory harmony, with a mean score of 3.95. However, 11.76% of students are considered very satisfactory, suggesting room for improvement in clarity and flow. A small percentage, 11.76%, are considered fair, suggesting challenges in creating harmony. The smallest group, 1.06%, has significant difficulties with text harmony, impacting readability and effectiveness. The data suggests a need for focused interventions to support students in enhancing their writing skills. Educators can implement structured writing exercises and peer reviews to enhance students’ ability to produce well-organized texts, preparing them for academic and professional communication.
Table 21: Students writing skills in terms of Text harmony
| Categories | F | P | MEAN | D |
| Outstanding | 63 | 33.64% | ||
| Very satisfactory | 78 | 41.71% | ||
| Satisfactory | 22 | 11.76% | 3.95 | Very Satisfactory |
| Fair | 22 | 11.76% | ||
| Poor | 2 | 1.06% | ||
| Total | 187 | 100% |
Table 22 shows that 48.66% of students display very satisfactory vocabulary skills, with 91 students using appropriate vocabulary. A smaller proportion, 20.85%, demonstrate outstanding vocabulary skills, with 39 students using a rich and varied vocabulary effectively. The majority of students have a decent command of vocabulary, but there is room for improvement. Fair students have limited vocabulary range or inappropriate word choice, while the smallest group has significant difficulties with vocabulary. A rich vocabulary contributes to effective communication in writing, and targeted support is needed to help students improve their vocabulary skills. Teachers can implement strategies such as vocabulary-building exercises, extensive reading, context-rich prompts, interactive activities, digital resources, and constructive feedback to enhance vocabulary skills and overall writing proficiency.
Table 22: Students writing along Vocabulary selection
| Categories | F | P | MEAN | D |
| Outstanding | 39 | 20.85% | ||
| Very satisfactory | 91 | 48.66% | ||
| Satisfactory | 30 | 16.54% | 3.75 | Very Satisfactory |
| Fair | 25 | 13.37% | ||
| Poor | 2 | 1.07% | ||
| Total | 187 | 100% |
The data shows that a significant proportion of students demonstrate satisfactory writing skills in terms of grammar. Outstanding grammar skills are present in a small proportion of students, while most are very satisfactory. Satisfactory grammar skills are present in a significant number of students, but there is room for improvement. Fair grammar skills are present in a smaller percentage of students, indicating a lack of understanding of essential rules. Poor grammar skills are the smallest, indicating significant difficulties in writing. Educators should focus on targeted instruction, incorporating exercises that reinforce grammatical rules and practice opportunities. This insight can guide instructional strategies to improve grammar proficiency in writing. Teachers can implement focused interventions, integrate grammar into writing activities, and leverage technology to provide immediate feedback and practice opportunities.
Table 23: Students writing along Grammar options
| Categories | F | P | MEAN | D |
| Outstanding | 20 | 10.70% | ||
| Very satisfactory | 94 | 50.27% | 3.55 | Very Satisfactory |
| Satisfactory | 44 | 23.53% | ||
| Fair | 27 | 14.44% | ||
| Poor | 2 | 1.07% | ||
| Total | 187 | 100% |
Table 24 shows students’ vocabulary usage in writing. Outstanding students use a diverse vocabulary, while very satisfactory students use appropriate vocabulary but lack complexity. Satisfactory students use a limited range of words or struggle with word choice, while fair students struggle with vocabulary usage and may use inappropriate words. Poor students have significant difficulties with vocabulary, impacting the clarity and effectiveness of their writing. A significant proportion of students demonstrate satisfactory vocabulary skills, with a mean score of 3.60. Targeted instructional strategies can help foster richer vocabulary and enhance overall writing proficiency. Practical implications include vocabulary-building activities, workshops, peer-assisted learning, and one-on-one tutoring. Teachers can use formative assessments to track vocabulary progress and adapt instruction accordingly.
Table 24: Students writing along Vocabulary writing
| Categories | F | P | MEAN | D |
| Outstanding | 26 | 13.91% | ||
| Very satisfactory | 89 | 47.59% | 3.60 | Very Satisfactory |
| Satisfactory | 44 | 23.53% | ||
| Fair | 26 | 13.90% | ||
| Poor | 2 | 1.07% | ||
| Total | 187 | 100% |
Table 25 shows students’ writing quality, with 19.25% demonstrating outstanding writing skills. The majority of students exhibit very satisfactory writing quality, with occasional errors or lack of sophistication. However, there is still room for refinement. The data suggests that while most students demonstrate satisfactory to very satisfactory writing skills, there is a need to focus on developing the writing abilities of those in the satisfactory and fair categories. A significant proportion of students demonstrate strong writing skills, with 71.66% categorized as very satisfactory and 19.25% as outstanding. However, attention should be given to the small number of students in the satisfactory and fair categories to ensure they receive the necessary support to enhance their writing quality. Practical implications include implementing targeted instructional strategies, mentorship programs, and fostering a culture of writing across disciplines. Providing more opportunities for practice, guided peer reviews, and direct support from teachers can help address their specific needs and strengthen their writing skills.
Table 25: Students writing along writing tidiness
| Categories | F | P | MEAN | D |
| Outstanding | 26 | 19.25% | ||
| Very satisfactory | 134 | 71.66% | ||
| Satisfactory | 12 | 6.42% | 4.07 | Very Satisfactory |
| Fair | 5 | 2.67% | ||
| Poor | ||||
| Total | 187 | 100% |
The study revealed that students demonstrate a high level of writing proficiency across various categories, with authenticity and content accordance being the most outstanding. However, there are areas for improvement in grammar, vocabulary, and sentence structure. Common grammar flaws include subject-verb agreement errors, misuse of prepositions, errors in possessives and pluralization, sentence structure and punctuation flaws, and word choice issues. These issues affect the clarity and coherence of students’ writing. To address these areas, instructional strategies should be implemented, including targeted grammar exercises, vocabulary-building activities, and sentence structure workshops. Teachers can also employ interactive activities to help students recognize and correct errors. Additionally, providing constructive feedback can guide students to refine their writing and develop a more sophisticated style. By focusing on these strategies, teachers can foster continuous improvement and support students in achieving a higher level of overall writing proficiency.
Table 26: Summary on Students’ Writing Skills
| Categories | MEAN | D |
| Authenticity | 4.25 | Outstanding |
| Content accordance with the title | 4.55 | Outstanding |
| Text Harmony | 3.95 | Very Satisfactory |
| Vocabulary selection | 3.75 | Very Satisfactory |
| Grammar options | 3.55 | Very Satisfactory |
| Vocabulary writing | 3.60 | Very Satisfactory |
| Writing tidiness | 4.07 | Very Satisfactory |
| Grand mean | 3.96 | Very Satisfactory |
Table 27: Significant Difference on the factors influencing Language Proficiency when analyzed according to Profile
| Category | U-Value | H-VALUE | P-VALUE | D |
| Age | – | 3.89 | .07 | Not significant |
| Sex | 3.57 | – | .003 | Significant |
| Academic strand | – | 3.54 | .002 | Significant |
The study revealed a significant difference in students’ writing skills based on age, sex, and academic strand. Age does not significantly impact writing skills, suggesting consistency across ages. However, sex and academic strand show significant relationships, suggesting varying levels of writing proficiency across different academic strands. This suggests that targeted interventions may be necessary to address the unique needs of different student groups. Gender also plays a role in writing proficiency, with differences in language development and writing skills between male and female students. Understanding these dynamics can help educators design more effective writing programs and instruction, ultimately enhancing overall writing proficiency. This understanding can help educators design more targeted, inclusive, and effective teaching strategies.
Table 28: Significant Relationship on the factors of Language Proficiency and English performance of the students
| Indicators | Mean | Mean
Diff. |
V-
Value |
D-
Value |
D |
| Factors and Speaking Skills | 3.15 | .57 | .27 | .007 | * |
| Factors and Writing Skills | 3.15 | .81 | .49 | .002 | * |
The data shows that factors affecting students’ English performance, particularly speaking and writing skills, have a significant impact on their performance. The mean score for speaking skills is 3.15, with a moderate level of influence. The same for writing skills, with a mean score of 3.15. These factors have a strong impact on improving writing skills among students. The results suggest that addressing these factors can enhance students’ overall English performance. The Engliscope: The Complete English Learning Kit is designed to provide engaging, interactive resources that address all four core language skills: reading, writing, speaking, and listening. The kit emphasizes vocabulary, grammar, and comprehensibility, fostering positive mindsets and motivation among learners. It also includes strategies to engage parents, such as guided home activities and resources that encourage parental support in language acquisition. The kit’s name, “Engliscope,” reflects its comprehensive scope and purpose, offering a well-rounded solution to enhancing English proficiency.
- CONCLUSION
The study investigated the relationship between factors affecting English language proficiency—specifically speaking and writing—and the English performance of Grade 12 learners at Polanco National High School for SY 2024–2025. It examined respondents’ profiles (age, sex, academic strand) and factors influencing proficiency, including language anxiety, cultural stereotypes, attitudes toward English, and parental, peer, and teacher influence. A descriptive-correlational design was used, with 187 respondents selected through stratified sampling from HUMSS, STEM, ABM, and TVL strands. Data were collected through a 5-point Likert-scale questionnaire and rubric-based speaking and writing assessments, and analyzed using appropriate statistical tools. Findings showed that most respondents were 17 years old, female, and from the HUMSS strand. Attitudes and perceptions toward English emerged as the most influential factor (mean = 3.80). Students demonstrated satisfactory proficiency, with strength in grammar, fluency, pronunciation, and accuracy in speaking, but needing improvement in vocabulary and writing comprehensibility. No significant differences were found across demographic profiles, but a significant relationship existed between proficiency factors and English performance. This suggests that personal motivation and learning experiences outweigh demographic characteristics in shaping proficiency. The study concluded that attitudes and perceptions strongly affect proficiency and performance, while gaps in vocabulary, grammar, and comprehensibility must be addressed for more effective communication. Theoretical frameworks by Vygotsky, Krashen, and Cummins reinforced the importance of both cognitive and affective dimensions in language learning. Recommendations include promoting engaging activities such as debates, storytelling, writing contests, vocabulary-building tasks, and targeted grammar instruction. Administrators are encouraged to implement structured programs like English boot camps, writing clinics, and public-speaking training, alongside continuous teacher development. Future research should identify the most critical factors influencing speaking and writing skills.
REFERENCES
- Nazri, S. N. A., & Kassim, A. (2023). Issues and Functions of Code-switching in Studies on Popular Culture: A Systematic Literature Review. International Journal of Language Education and Applied Linguistics, 13(2), 7-18.
- Albahoth, Z. M., Jabar, M. B. A., & Jalis, F. M. B. M. (2024). A systematic review of the literature on code-switching and a discussion on future directions. International Journal of Academic Research in Business and Social Sciences, 14(2), 61-80.
- Ataş, U., & Sağın-Şimşek, Ç. (2021). Discourse and educational functions of students’ and teachers’ code-switching in EFL classrooms in Turkey. Linguistics and Education, 65, 100981.
- Temesgen, A., & Hailu, E. (2022). Teachers’ codeswitching in EFL classrooms: Functions and motivations. Cogent Education, 9(1), 2124039.
- Kumar, T., Nukapangu, V., & Hassan, A. (2021). Effectiveness of code-switching in language classroom in India at primary level: a case of L2 teachers’ perspectives. Pegem Journal of Education and Instruction, 11(4), 379-385.
- Pintado Gutiérrez, L. (2021). Translation in language teaching, pedagogical translation, and code-Switching: restructuring the boundaries. The Language Learning Journal, 49(2), 219-239.
- Zhong, X., & Ang, L. H. (2023). Systematic Literature Review of Conversational Code-Switching in Multilingual Society from a Sociolinguistic Perspective. Theory & Practice in Language Studies (TPLS), 13(2).
- Zainil, Y., & Arsyad, S. (2021). Teachers’ perception of their code-switching practices in English as a foreign language classes: The results of stimulated recall interview and conversation analysis. Sage Open, 11(2), 21582440211013802.
- Blair, M., & Morini, G. (2023). From one language to the other: Examining the role of code-switching on vocabulary learning in adult second-language learners. Second Language Research, 39(4), 1027-1048.
- Heugh, K., Harding-Esch, P., & Coleman, H. (2021). Southern multilingualisms, translanguaging and transknowledging in inclusive and sustainable education. Language and the sustainable development goals, 37-47.
- Ramzan, M., Khan, M. A., & Sarwar, M. (2023). Style Shift: A Comparative Cultural Analysis of Pride and Prejudice and Unmarriageable. University of Chitral Journal of Linguistics and Literature, 7(II), 22-29.
- Harrington, C. N., Garg, R., Woodward, A., & Williams, D. (2022, April). “It’s kind of like code-switching”: Black older adults’ experiences with a voice assistant for health information seeking. In Proceedings of the 2022 CHI Conference on Human Factors in Computing Systems(pp. 1-15).
- Yim, O., & Clément, R. (2021). Acculturation and attitudes toward code-switching: A bidimensional framework. International Journal of Bilingualism, 25(5), 1369-1388.
- Masruddin, M., & Nasriandi, N. (2022). Lexical and Syntactical Errors Performed by Junior High School Student in Writing Descriptive Text. IDEAS: Journal on English Language Teaching and Learning, Linguistics and Literature, 10(1), 1094-1100.
- Tiawati, R. L., Kurnia, M. D., Nazriani, N., Annisa, W., & Harahap, S. H. (2024). Cultural literacy in indonesian language learning for foreign speakers (BIPA): Overcoming barriers and fostering language proficiency with cross-cultural understanding issues. Journal of Pragmatics and Discourse Research, 4(1), 22-31.
- Ahmad, G. I., Singla, J., Ali, A., Reshi, A. A., & Salameh, A. A. (2022). Machine learning techniques for sentiment analysis of code-mixed and switched indian social media text corpus-a comprehensive review. International Journal of Advanced Computer Science and Applications, 13(2).
- Sahan, K., & Rose, H. (2021). Problematising the E in EMI: Translanguaging as a pedagogic alternative to English-only hegemony in university contexts. English-medium instruction and translanguaging, 1-14.
- Sah, P. K., & Li, G. (2022). Translanguaging or unequal languaging? Unfolding the plurilingual discourse of English medium instruction policy in Nepal’s public schools. International Journal of Bilingual Education and Bilingualism, 25(6), 2075-2094.
- Lorenz, E., Krulatz, A., & Torgersen, E. N. (2021). Embracing linguistic and cultural diversity in multilingual EAL classrooms: The impact of professional development on teacher beliefs and practice. Teaching and Teacher Education, 105, 103428.
- Liu, Y., & Fang, F. (2022). Translanguaging theory and practice: How stakeholders perceive translanguaging as a practical theory of language. RELC journal, 53(2), 391-399.
- Anderson, J., & Lightfoot, A. (2021). Translingual practices in English classrooms in India: Current perceptions and future possibilities. International Journal of Bilingual Education and Bilingualism.
- Cummins, J. (2021). Translanguaging: A critical analysis of theoretical claims. Pedagogical translanguaging: Theoretical, methodological and empirical perspectives, 7-36.
- AlNajdi, S. M. (2022). The effectiveness of using augmented reality (AR) to enhance student performance: using quick response (QR) codes in student textbooks in the Saudi education system. Educational technology research and development, 70(3), 1105-1124.
- Saidjonovna, V. T. (2024). LINGUISTIC AND CULTURAL ASPECTS OF INTERNET COMMUNICATION IN UZBEK. University Research Base, 301-307.
- Lightfoot, A., Balasubramanian, A., Tsimpli, I., Mukhopadhyay, L., & Treffers-Daller, J. (2022). Measuring the multilingual reality: lessons from classrooms in Delhi and Hyderabad. International Journal of Bilingual Education and Bilingualism, 25(6), 2208-2228.
Publication History
Submitted: March 17, 2025
Accepted: March 30, 2025
Published: March 31, 2025
Identification
D-0441
DOI
https://doi.org/10.71017/djsi.4.03.d-0441
Citation
Rose Anne I. Capadeso & Quindhe M. Banquiao (2025). Factors Influencing Language Proficiency Among Grade 12 Learners in Relation to Their Performance. Dinkum Journal of Social Innovations, 4(03):141-157.
Copyright
© 2025 The Author(s).