

Publication History
Submitted: July 23, 2025
Accepted: August 11, 2025
Published: August 31, 2025
Identification
D-0515
DOI
https://doi.org/10.71017/djsi.4.08.d-0515
Citation
Bhumi Prasad Shrma (2025). Effect of Students’ Attitude and Anxiety on Mathematics Achievements in the Schools of Kailali. Dinkum Journal of Social Innovations, 4(08):603-619.
Copyright
© 2025 The Author(s).

603-619
Effect of Students’ Attitude and Anxiety on Mathematics Achievements in the Schools of KailaliOriginal Article
Bhumi Prasad Shrma 1*
- Nepal Open University, Manbhawan, Lalitpur, Nepal
* Correspondence: bhumisharma152@gmail.com
Abstract: In the context of school education, students frequently perceive mathematics as difficulty, challenging, and uncomfortable, which reflects their attitudes and anxieties towards the subject. Such anxiety is a significant concern for educators, students, and other stakeholders. Even students with the potential for success may struggle to realize their abilities due to their attitudes and anxiety towards mathematics. Therefore, this study explored the status of Grade ten students’ attitudes and anxiety toward mathematics and their effects on mathematics achievement. Employing quantitative survey design, data were collected through a validated questionnaire based on established mathematics attitude and anxiety scales. The pilot tests confirmed the reliability of the tools. The final questionnaire consists of 24 items, and Cronbach’s alpha values exceeding 0.70 confirm the scale’s reliability. The final sample consisted of 387 students from eight schools selected through multistage sampling in the Kailali district of Nepal. Descriptive and inferential statistical analyses showed that 60.71 percent of students have Grade E scores in the SEE examination. Regression analysis indicated that students’ attitudes towards mathematics (b = -0.28, p = 0.01), mathematics anxiety (b = -0.13, p = 0.03), and parental education (b = 0.13, p = 0.01) were significant predictors of mathematics achievement, while gender, religion, ethnic group, and school type had no significant effects (p > 0.05). There is a moderate and significant relationship exists between attitude and anxiety towards mathematics and mathematics achievements. Students with university-educated parents had significantly higher levels of mathematics achievement, confirmed by the Tukey HSD test. The findings suggest that fostering positive attitudes, addressing anxiety through mindfulness and parental involvement, and promoting self-efficacy and mastery-oriented learning can help close the mathematics achievement gap. However, the study’s focus on a small sample from the Kailali limits the generalizability of the results. Further study should expand to include students from other grades, a larger sample, different regions, and employ a mixed-method approach to provide deeper insights.
Keywords: students’ attitude, anxiety, mathematics, achievements, deeper insights
- INTRODUCTION
The development of mathematics and human civilization go hand in hand, as mathematics was created and applied to fulfill human needs related to daily life, such as social needs and demands. Education is the key to all processes of development, especially human development [1]. The history of mathematics demonstrates how modern society has benefited from its development. Mathematics serves as a fundamental subject that plays a crucial role in various academic disciplines and real-world applications. However, in numerous studies, it has been widely asserted that students commonly hold negative perceptions about mathematics, such as feelings of difficulty, hardness, challenge, and impersonality, predominantly associated with masculinity [2]. For many students, mathematics has been a challenging subject during their schooling and higher-level education, and its regard as uninteresting and disengaging led to a dislike for the subject [3]. The experience of negative emotions and reactions, including fear, worry, frustration, tension, and helplessness, in response to mathematical challenges gives rise to mathematics anxiety [3]. According to the Education Review Office (ERO) report 2020 and 2023, a significant proportion of the students are underperforming in school-level education, especially in mathematics, and their achievement has exhibited a decline trend over recent years. The research study focuses on investigating the effect of attitude and anxiety towards mathematics on the mathematics achievement of tenth-grade students within the local context of the Kailali district in the far-western province of Nepal. Education is often described as the mirror of society, which reflects the values, perceptions, and characteristics of a particular community [4]. It serves as a reflection of societal norms, cultural practices, and collective aspirations. An author [5] asserts that the school system is essential in molding people and enabling them to take on responsible and active roles in society. Through education, societies transmit their knowledge, traditions, and ideals to the next generation, which helps the social, economic, and cultural development of the community or society. Education is recognized as a powerful tool for bringing about changes in socio-economic and cultural development, transforming society, and uplifting individuals and the nation as a whole [6]. It inspires social mobility and enables individuals to acquire knowledge, skills, and competencies for a globalized world [7]. The universal right to education has granted individuals the liberty to pursue academic disciplines of their preference throughout their lifetimes. Individuals gain the ability to analyze information, make decisions, participate in democratic processes, promote cultural diversity and tolerance, reduce poverty, promote gender equality, and contribute to the overall development of society through education [8]. The foundations of mathematics open up fresh perspectives on existing activities. Mathematics is a multidimensional subject that deals directly with the reality of human daily life, enriches our understanding, and enhances various aspects of our experiences [9]. It is a substantial and integral part of an organized society [10]. As [11] notes, mathematics is part of our daily lives. The field of mathematics has been progressing alongside the advancement of civilization throughout history [12]. The significance of mathematics keeps on being perceived in the contemporary cultural system for formal schooling. As stated by [13], mathematics is the language of science and innovation for understanding and explaining phenomena in our world. It provides a systematic approach to problem-solving, critical thinking, and logical reasoning, which are essential skills for success in numerous fields such as engineering, computer science, finance, and economics [14]. Therefore, mathematics education remains a cornerstone in the modern educational landscape, equipping students with the necessary tools for intellectual growth and engagement with the complexities of the world. Mathematics is a fundamental tool for scientific inquiry, technological advancements, and economic development and an integral part of society [15]. It enables us to analyze complex phenomena, solve problems, and make decisions in fields such as engineering, finance, medicine, and social sciences [16]. Moreover, mathematics plays a crucial role in shaping our everyday lives and making choices about health and well-being [4]. It fosters logical thinking, abstract reasoning, and critical analysis in individuals with essential skills for success in a changing world [2]. Consequently, mathematics has established itself as an indispensable entity for the continuation and advancement of modern times. In the modern world, it is impossible to go through a single day without encountering mathematics. Roger Bacon, a renowned philosopher, scientist, and scholar from the 13th century, stated that neglecting mathematics hinders the understanding of other sciences and worldly matters [17]. Mathematics anxiety is a common phenomenon characterized by discomfort and unease when individuals face mathematical tasks [6]. It involves negative emotions and reactions such as fear, worry, tension, and helplessness [8,14,15]. Individuals experiencing mathematics anxiety may doubt their ability to understand and perform mathematics, and they can avoid mathematics-related activities and courses [18]. The mathematical issue poses challenges for students as they may encounter physical and psychological symptoms such as heart palpitations, sweating, nausea, breathing difficulties, and cognitive confusion [19]. The exact causes of mathematical anxiety are not entirely understood. An author expressed that mathematics anxieties can have both positive and negative aspects and added that if anxiety leads to progressive thinking, it can be beneficial, whereas if it leads to regressive thinking, it can be detrimental [12]. The symptoms of mathematical anxiety can manifest as both psychological and physiological reactions [13]. Mathematics nervousness adversely affects understudies’ scientific accomplishments and perspectives towards mathematics. Factors such as teachers’ teaching strategies, students’ beliefs, and external environments contribute to mathematics anxiety [20]. Mathematics, as a multidimensional subject, holds significant importance in enriching human experiences and facilitating understanding in various aspects of daily life. Its role in problem-solving, critical thinking and logical reasoning is pivotal for success in diverse fields such as engineering, finance, and medicine. Despite its indispensable nature, mathematics often evokes feelings of anxiety and fear among students, hindering their academic performance and career prospects. Negative attitudes towards mathematics, coupled with anxiety, create barriers to learning and contribute to students’ avoidance of mathematics-related activities. These challenges persist despite the widespread recognition of mathematics as an essential tool for scientific inquiry, technological advancements, and economic development. Consequently, there is a pressing need to delve deeper into the factors influencing students’ attitudes, anxieties, and achievements in mathematics, particularly within the Kailali district of the Nepalese educational context. In response to the identified research gap, this research endeavor to examine the current state and interplay of the variables, especially focusing on students’ attitudes, anxiety, and achievement in mathematics. This study examined the effect of tenth-grade students’ attitude and anxiety on their mathematics achievements in secondary schools within the Kailali district. Specifically, it evaluated the status of students’ attitudes and anxiety towards mathematics, determines their relationship and effect on mathematics achievement, and examines how socio-demographic factors, such as gender, religion, ethnic group, and parental education, as well as the students’ attitude and anxiety towards mathematics, affect their mathematics achievement.
- MATERIALS AND METHODS
This study adopts a survey methodology within a quantitative research design, grounded in a positivist philosophical paradigm. The relationship and effects between attitudes and anxiety towards mathematics on student mathematics achievement are treated as a measurable factor. By observing from a positivist perspective, the research focuses on objective data and empirical evidence to understand the influence of these psychological factors on mathematics achievement. The survey method enables a systematic collection of data from tenth grade students in Kailali, facilitating an objective analysis of their attitudes, anxiety, and achievement in mathematics. In this study, a questionnaire was employed to assess student attitude and anxiety towards mathematics at specified time points, using Likert-type scales for data collection. The descriptive survey method was deemed appropriate, as it effectively captures the current situation. The survey comprised well-structured questions and scales aimed at collecting comprehensive data on students’ attitudes and anxiety towards mathematics. These instruments measure the various dimensions such as perceptions of difficulty, interest, self-efficacy, and emotional responses to mathematical tasks. Additionally, the survey gathered information on institutional, familiar, and personal characteristics, along with students’ mathematics achievement reflected SEE scores and self-reported perceptions of academic success. This study’s population consisted of all grade ten students who were exam-preparing for the SEE 2078 BS in Kailali. According to the Center for Education and Human Resource Development (CEHRD), Flash I Report 2078 BS (2021/22), in the Kailali district, there are a total of 891 schools and 174 secondary schools (up to grade 10), of which 93 (53.45 percent) are community and 81 (46.55 percent) are institutional secondary schools (up to grade 10). The total number of tenth-grade students in both community and institutional schools in Kailali district was 18,852 (Flash I Report, 2078 BS). So, the population of this study comprises 18,852 tenth-grade students in Kailali. The sampling frame, representing the comprehensive list of units (students) from which the sample would be selected, was established by considering the entirety of the tenth-grade student population in the Kailali district. The sampling frame was constructed using data from educational institutions and administrative records, which gave a comprehensive list of the potential participants. The district was divided into one sub-metropolitan, six municipalities, and six rural municipalities based on a political and administrative division in Kailali. Firstly, the population is divided into two groups: institutional and community-based schools (up to grade 10), where the institutional-based schools were 81 and the community-based schools were 93. This cluster is selected from the institutions based on political and administrative division. Then eight schools were selected based on the frame and the divisions of municipalities in Kailali. The detailed numbers of the schools and students in the sampling frame are listed in Table 1 as follows:
Table 01: Frequencies of Population for the Sampling Frame
| Rural/Municipality | Institutional-based secondary schools | Community-based secondary schools | No. of the students |
| Bhajani MC | 1 | 12 | 837 |
| Bardagoriya RMC | 4 | 5 | 856 |
| Dhangadhi SMC | 34 | 28 | 4166 |
| Total in Selected Area | 39 | 45 | 5859 |
| Total in Kailali | 81 | 93 | 18852 |
A multi-stage sampling methodology has been utilized to procure the sample for this study. The representation of three types of municipalities: rural municipalities, municipalities, and sub-metropolitan, and averaging number of students in the schools in Kailali. The sample was based on three municipalities and eight schools. The sample size for this study was 50 percent drawn from the population of 18,852, with a margin of variation of 5 percent and a confidence level of 95 percent. A sample size of 377 or more is required for an accuracy degree of 95 percent with a 5 percent allowance of variation, using Cochran’s formula. All students enrolled in the tenth grade across these eight schools, from both institutions and community-based, and three municipalities were designated as respondents for the survey. To facilitate survey dissemination, a questionnaire was randomly distributed to 142 samples within each municipality, including institutions and community-based schools, entirely targeting those students who expressed participation and were attending school. However, some students could not participate, or their responses remained incomplete. Consequently, the final sample consisted of 387 students. The data collection phase spanned approximately three weeks, during which survey responses were systematically gathered from classrooms in eight schools in the Kailali District. The tools or instruments that are used to gather information or data have a direct effect on the reliability of the research findings as well as planning, methodology, and data interpretation. When choosing a research instrument for a study, factors including the study’s objective, the time allotted for it, the availability of appropriate tests, and their statistical properties are important. The use of multiple data-gathering instruments, such as questionnaires and document analysis, allowed for a comprehensive and triangulated approach to data collection. The questionnaire provided subjective insights into participants’ attitudes and perceptions, while school records of SEE result analysis provided objective data related to their actual mathematics achievement. The Mathematics Anxiety Questionnaire (MAQ) was implemented as a major instrument of data collection. The study visited the randomly selected school and collected data from grade 10 mathematics classes at the school with the permission of the school administrator and subject teacher, and all students who attended mathematics classes were requested to complete a questionnaire. The data obtained from the survey instruments in this study were analyzed using Statistical Package for the Social Sciences (SPSS), version 23. Descriptive analysis focuses on describing the main features of the data, such as central tendency and validity. Inferential analysis involves applying statistical techniques to test hypotheses, determine effects and relationships between variables, and make predictions. ANOVA allows for the comparison of mean scores across multiple groups, such as students from socio-demographic backgrounds, providing valuable insights into the effect of various factors on attitudes, anxiety, and achievement in mathematics. The study used regression analysis to assess the effects of math anxiety on achievement in mathematics while considering multiple predictor variables simultaneously. The study has followed the ethical guidelines established by the Nepal Open University.
- RESULTS AND DISCUSSION
The study, which included 387 individuals, investigates the prevalence and distribution of these characteristics, as shown in Table 02 and Figure 02. These statistics show the composition and diversity of the study’s participants, facilitating a deeper understanding of the research context. The moderate variables were socio-demographic characteristics, including gender, religion, school type, parent’s education, and ethnic group. By examining these characteristics, the research ensures a more accurate analysis of the relationships between attitudes, anxiety, and mathematics achievement.
Table 02: Scio-demographic Characteristics Statistics of the Sample
| Scio-demographic
Characteristics |
Categories | N | Percentage |
| Gender | |||
| Female | 213 | 55 | |
| Male | 174 | 45 | |
| Religion | |||
| Hindu | 361 | 93.3 | |
| Non-Hindu | 26 | 6.7 | |
| School Type | |||
| Community base | 290 | 75 | |
| Institutional base | 97 | 25 | |
| Parent’s Education | |||
| Illiterate | 93 | 24 | |
| Literate | 123 | 31.8 | |
| School/Up to grade 12 | 145 | 37.7 | |
| Campus/University | 26 | 6.7 | |
| Ethnic Group | |||
| Brahman | 74 | 19.1 | |
| Kshetri | 125 | 32.3 | |
| Janajati | 134 | 34.6 | |
| Dalit | 48 | 12.4 | |
| Others | 6 | 1.6 |
The sample included 213 female students, accounting for 55% of the participants, and 174 male students, representing 45% of the participants. In terms of religion, the majority of the participants identified as Hindu, with 361 students (93.3%) and 26 students (6.7%) identified as non-Hindu. The participants were from different school types, with 290 students (75%) attending community-based schools and 97 students (25%) attending institutional-based schools.
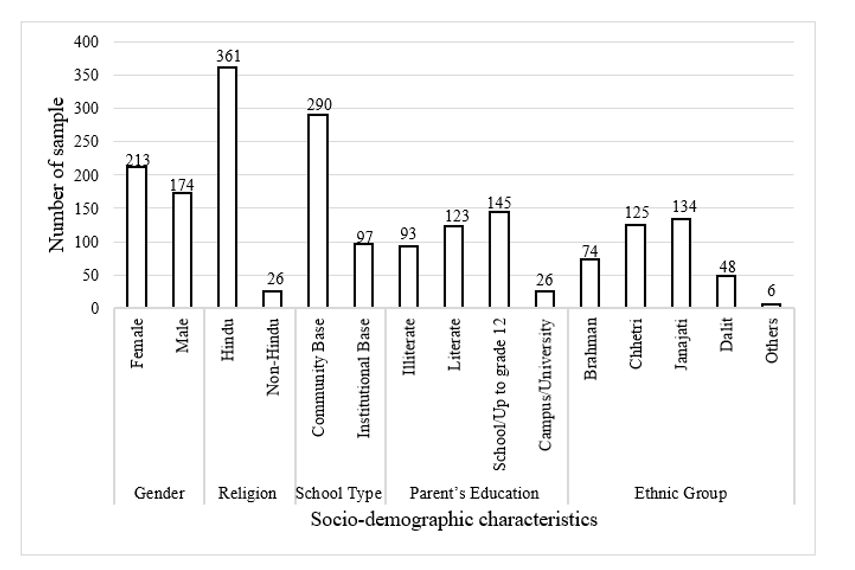
Figure 01: Scio-demographic Characteristics Statistics of the Sample
The result focused on all those who participated in the survey for a sample and all students who attempted the SEE examination 2078 in Kailali. Notably, the survey occurred before the Secondary Education Examination (SEE) of the academic year 2078 BS. The National Examination Board results represent the achievement levels within the sample and population and offer insights into the mathematical achievement of the students chosen for the study. The use of SEE mathematics results in this study enables a more comprehensive and integrative analysis of mathematics achievements in terms of mathematics anxiety. This, in turn, enables a detailed achievement of how it connects with other significant factors.
Table 03: Mathematics Achievement of the Sample and Population
| Grade | Participants | District | |||
| Frequency | Percentage | Frequency | Percentage | ||
| A+ | 3 | 0.78 | 87 | 0.50 | |
| A | 4 | 1.03 | 260 | 1.49 | |
| B+ | 3 | 0.78 | 421 | 2.41 | |
| B | 9 | 2.33 | 699 | 3.99 | |
| C+ | 11 | 2.84 | 1038 | 5.93 | |
| C | 12 | 3.10 | 1648 | 9.42 | |
| D+ | 40 | 10.34 | 2104 | 12.02 | |
| D | 70 | 18.09 | 2200 | 12.57 | |
| E | 235 | 60.71 | 9041 | 51.67 | |
| Total | 387 | 100.0 | 17498 | 100.0 | |
Table 04: Descriptive Statistics of Student Attitude Towards Mathematics
| Statement Description | Mean | S.D. | |
| Mathematics is a very worthwhile and necessary subject. | 4.17 | 0.97 | |
| Mathematics knowledge can help to study another subject. | 3.99 | 0.94 | |
| Leaning mathematics would help to develop creative/critical thinking. | 4.04 | 0.96 | |
| Learning mathematics skills is important for future. | 4.21 | 0.88 | |
| Mathematics is important in everyday life. | 4.09 | 0.99 | |
| Every career uses mathematics. | 3.83 | 1.19 |
Table 05: Descriptive Statistics of Student’s Anxiety Towards Mathematics
| Statement description | Mean | S. D. | |
| I usually feel nervous in mathematics class. | 3.08 | 1.06 | |
| I worry that other students might understand mathematics problems better than I do. | 3.26 | 1.18 | |
| I feel stressed when I’m about to take a mathematics test. | 3.14 | 1.29 | |
| When the mathematics teacher enters mathematics class, my heart skipping a beat. | 3.16 | 1.22 | |
| Being called on to answer a mathematics question scares me. | 3.21 | 1.22 | |
| I feel frustrated when working on mathematics problems. | 2.99 | 1.15 | |
| I had trouble sleeping the night before the mathematics test. | 3.07 | 1.30 | |
| I avoid my mathematics homework. | 3.10 | 1.27 | |
| I need extra help in mathematics. | 3.68 | 1.27 | |
| Even when I need help, I won’t ask for help. | 2.95 | 1.26 | |
| After getting a mathematics test back, I don’t want others to see my score. | 2.93 | 1.31 | |
| I said “I don’t touch/hated mathematics” in grade 11. | 3.02 | 1.15 |
Table 06: Descriptive Statistics of Student’s Mathematics Anxiety
| Statement description | Mean | S. D. | |
| I usually feel nervous in mathematics class. | 3.08 | 1.06 | |
| I worry that other students might understand mathematics problems better than I do. | 3.26 | 1.18 | |
| I feel stressed when I’m about to take a mathematics test. | 3.14 | 1.29 | |
| When the mathematics teacher enters mathematics class, my heart skipping a beat. | 3.16 | 1.22 | |
| Being called on to answer a mathematics question scares me. | 3.21 | 1.22 | |
| I feel frustrated when working on mathematics problems. | 2.99 | 1.15 | |
| I had trouble sleeping the night before the mathematics test. | 3.07 | 1.30 | |
| I avoid my mathematics homework. | 3.10 | 1.27 | |
| I need extra help in mathematics. | 3.68 | 1.27 | |
| Even when I need help, I won’t ask for help. | 2.95 | 1.26 | |
| After getting a mathematics test back, I don’t want others to see my score. | 2.93 | 1.31 | |
| I said “I don’t touch/hated mathematics” in grade 11. | 3.02 | 1.15 |
Table 07: Descriptive Statistics of Scio-demographics Characteristics and MA
| Scio-demographic characteristics | Categories | Number | Average MA | S.D. |
| Gender | ||||
| Female | 213 | 3.26 | 0.94 | |
| Male | 174 | 3.53 | 0.85 | |
| Religion | ||||
| Hindu | 361 | 3.40 | 0.89 | |
| Non-Hindu | 26 | 3.44 | 0.99 | |
| School Type | ||||
| Community | 283 | 3.34 | 0.92 | |
| Institutional | 104 | 3.56 | 0.82 | |
| Parent’s Education | ||||
| Illiterate | 93 | 3.34 | 0.94 | |
| Literate | 123 | 3.45 | 0.92 | |
| School/Up to grade 12 | 145 | 3.49 | 0.84 | |
| Campus/University | 26 | 3.26 | 0.95 | |
| Ethnic Group | ||||
| Braman | 74 | 3.20 | 1.01 | |
| Kshetri | 125 | 3.36 | 0.92 | |
| Janajati | 134 | 3.56 | 0.82 | |
| Dalit | 48 | 3.34 | 0.86 | |
| Others | 6 | 3.70 | 0.83 | |
Table 08: Pearson Co-relation Between ATM and Achievement
| Variables | Correlations | Attitude towards Mathematics | Mathematics Achievement |
| Attitude towards Mathematics | Pearson Correlation *Sig. (2-tailed) | 1 | 0.36
0.00* |
| Mathematics achievement | Pearson Correlation *Sig. (2-tailed) | 0.36
0.00* |
1 |
In this study, a bivariate parametric statistical analysis utilizing Pearson’s correlation was used. The decision to use Pearson’s correlation was based on the outcomes of the Shapiro-Wilk test for normality, which were outlined in Appendix F, conforming to the normal distribution of the variables. As illustrated in Table 8, the Pearson correlation coefficient was calculated to be 0.36, denoting a moderate level of correlation between participants’ attitudes towards mathematics and achievement in mathematics. Furthermore, the p-value (p (0.00) < 0.05) denotes a statistically significant relationship between individuals’ attitudes towards mathematics and achievement in mathematics. The analytical result further presents a moderately positive correlation, suggesting that students who manifest a more favorable attitude toward mathematics tend to exhibit elevated levels of proficiency and success in the subject.
Table 09: Pearson Co-relation between MA and Achievement
| Variables | Correlations | Mathematics anxiety | Mathematics achievement |
| Mathematics anxiety | Pearson correlation *Sig. (2-tailed) | 1 | -0.47
0.02* |
| Mathematics achievement | Pearson correlation *Sig. (2-tailed) | -0.47
0.02* |
1 |
A bivariate parametric statistic of Pearson correlation was used because the Shapiro-Wilk test for normality and variables was normally distributed. As indicated in the above table, Pearson’s correlation coefficient was -0.47, indicating a moderately negative correlation between mathematics anxiety and achievement in mathematics among the participants. Further, the p-value (p (0.02) < 0.05) indicates a statistically significant correlation between mathematics anxiety and mathematics achievement. Therefore, the analysis exposes that there are significant negative relationships between anxiety towards mathematics and mathematics achievement. This finding underscores the detrimental effect of attitude and anxiety on students’ achievement in mathematics, suggesting that interventions aimed at reduced anxiety could potentially improve mathematics achievements. The negative correlation implies that the students experiencing a higher level of anxiety in mathematics tend to perform worse in their mathematics assessments, and addressing the emotional and psychological factor in education strategies to enhance student achievements.
Table 10: Independent t-test of ATM (Positive-Negative) and Achievement
| Attitude | N | Achievement Mean | SD | df | t-value | Sig. | Cohen’s d |
| Positive | 273 | 1.80 | 0.94 | 385 | 3.54 | 0.00* | 0.32 |
| Negative | 114 | 1.75 | 0.88 |
Table 11: Independent t-test of MA (Low-High) and Achievement
| MA | N | Achievement Mean | SD | df | t-value | Sig. | Cohen’s d |
| Low | 141 | 1.82 | 0.92 | 385 | 3.10 | 0.01* | 0.38 |
| High | 246 | 1.72 | 0.88 |
Table 12: Independent t-test of ATM and Achievement
| Statement description | Achievement | N | Mean | S.D. | df | Sig. | |
| Mathematics is a very worthwhile and necessary subject. | High | 39 | 4.13 | 1.01 | 385 | 0.02* | |
| Low | 348 | 3.67 | 0.93 | ||||
| Mathematical knowledge can help study another subject. | High | 39 | 3.49 | 0.81 | 385 | 0.10 | |
| Low | 348 | 3.11 | 0.96 | ||||
| Learning mathematics would help to develop creative/critical thinking. | High | 39 | 4.18 | 0.87 | 385 | 0.03* | |
| Low | 348 | 4.01 | 0.97 | ||||
| Learning math skills is important for the future. | High | 39 | 4.15 | 0.93 | 385 | 0.00* | |
| Low | 348 | 3.21 | 0.88 | ||||
| Mathematics is important in everyday life. | High | 39 | 3.88 | 1.01 | 385 | 0.10 | |
| Low | 348 | 3.19 | 0.99 | ||||
Table 13: Independent t-test of Mathematics Anxiety (MA) and Achievement
| Statement description | Achievement | N | Mean | S.D. | df | Sig. | |
| Getting ready to study for mathematics test. | High | 39 | 3.33 | 1.16 | 385 | 0.01* | |
| Low | 348 | 3.03 | 1.25 | ||||
| Thinking to be well in mathematics | High | 39 | 3.56 | 1.42 | 385 | 0.02* | |
| Low | 348 | 3.41 | 1.39 | ||||
| Thinking about an upcoming mathematics test. | High | 39 | 3.38 | 1.35 | 385 | 0.19 | |
| Low | 348 | 3.45 | 1.31 | ||||
| Taking an exam in a mathematics subject. | High | 39 | 2.95 | 1.23 | 385 | 0.16 | |
| Low | 348 | 3.49 | 1.19 | ||||
| Listening/receiving the final mathematics grade. | High | 39 | 3.56 | 1.27 | 385 | 0.01* | |
| Low | 348 | 3.41 | 1.38 | ||||
Table 14: Independent t-test of Mathematics Achievement and Socio-demographic Variables
| Variable | N | Mean | SD | Sig. | Cohen’s d |
| Gender | |||||
| Male | 174 | 1.83 | 0.93 | 0.40 | 0.29 |
| Female | 213 | 1.75 | 0.90 | ||
| School | |||||
| Community | 283 | 1.78 | 0.92 | 0.72 | 0.11 |
| Institutional | 104 | 1.81 | 0.90 | ||
| Religion | |||||
| Hindu | 361 | 1.80 | 0.90 | 0.27 | 0.22 |
| Non-Hindu | 26 | 1.53 | 0.70 |
Table 15: Analysis of Variance of Mathematics Achievement and Socio-Demographics
| Source of variation | Sum of Squares | Mean Square | Df | F-value | Sig. | Eta-sq ( ) |
| Ethnic Group | ||||||
| Between-group | 3.65 | 0.73 | 5 | 0.87 | 0.41 | 0.024 |
| Within group | 316.40 | 0.83 | 381 | |||
| Total | 320.04 | 386 | ||||
| Parent Education | ||||||
| Between-group | 1.73 | 0.57 | 3 | 0.69 | 0.01* | 0.104 |
| Within-group | 318.31 | 0.83 | 383 | |||
| Total | 320.04 | 386 | ||||
Table 16: Parent Education Tukey Test for Mathematics Achievement
| Participants’ parents’ education(I) | Participants’ parents’ education (J) | Mean difference (I-J) | S.E. | Sig. |
| Illiterate | Literate | -0.41 | 0.12 | 1.00 |
| School level | -0.17 | 0.13 | 0.84 | |
| Campus or University | -0.27 | 0.19 | 0.03* | |
| Literate | Illiterate | 0.41 | 0.12 | 1.00 |
| School level | -0.08 | 0.11 | 0.37 | |
| Campus or University | -0.30 | 0.20 | 0.02* | |
| School level | Illiterate | 0.17 | 0.13 | 0.84 |
| Literate | 0.08 | 0.11 | 0.37 | |
| Campus or University | -0.19 | 0.19 | 0.14 | |
| Campus or University | Illiterate | 0.27 | 0.19 | 0.03* |
| Literate | 0.30 | 0.20 | 0.02* | |
| School level | 0.19 | 0.19 | 0.14 |
Table 17: Regression Analysis of Mathematics Achievement on related factors
| Source of Variation | Sum of Squares | df | Mean Square | F | R2 | Adjusted R2 | Sig. |
| Regression | 2.712 | 6 | 0.45 | 0.54 | 0.28 | 0.27 | 0.00* |
| Residual | 317.335 | 380 | 0.83 | ||||
| Total | 320.047 | 386 |
*Significance < 0.05 (Dependent variable: SEE Achievement or result of mathematics in 2078, Predictors: (Constant), school type, religion, ethnic group, gender, parents’ education, attitude and anxiety towards mathematics)
Table 18: Regression analysis on Mathematics Achievement in General
| Variable | Regression coefficient (b) | Standard Error | Beta coefficient (𝜷)
|
t | Sig. |
| Constant | 32.07 | 4.38 | 5.43 | 0.00 | |
| Attitude | -0.28 | 0.81 | -0.19 | -0.34 | 0.01* |
| Anxiety | -0.13 | 0.53 | 0.12 | -0.24 | 0.03* |
| Gender | 0.69 | 0.95 | 0.38 | 0.72 | 0.40 |
| Religion | 0.56 | 0.86 | 0.70 | 1.37 | 0.11 |
| Ethnic Group | 0.00 | 0.30 | 0.01 | 0.13 | 0.41 |
| Parents Edu. | 0.13 | 0.53 | 0.11 | 0.31 | 0.01* |
| School Type | 0.14 | 0.17 | 0.07 | -0.15 | 0.43 |
The regression coefficients indicate the magnitude and direction of the relationship between each independent variable, the dependent variable, and moderator. Table 18 presents the results of the regression analysis in general, investigating the relationship between various independent variables (attitude towards math, math anxiety and the dependent variable, mathematics achievement, and moderator gender, religion, ethnic group, parents’ education, and school type). The first row of the table displays information about the constant term (Constant), which represents the predicted math achievement score when all other predictor variables are zero. The coefficient value is 32.07, and it is statistically significant at the conventional significance level (t = 5.43, p < 0.05), indicating that math achievement is significantly affected even without considering any of the predictor variables. Next, the table shows the regression coefficients (b) for each independent variable, indicating the change in math achievement associated with a one-unit change in the respective predictor while holding other variables constant. The Standard Error provides the measure of uncertainty or variability associated with each regression coefficient. The Beta coefficient (β) represents the standardized regression coefficient, allowing for a comparison of the relative importance of different predictors in influencing the dependent variable. It indicates the strength and direction of the relationship between each predictor and mathematics achievement, after controlling for the influence of other variables. The regression analysis results are as follows: Attitude towards mathematics (b = -0.28, beta coefficient = -0.19, t = -0.34, p = 0.01), and mathematics anxiety (b = -0.13, Beta coefficient = 0.12, t = -0.24, p = 0.03) show statistically significant relationships with mathematics achievement at the conventional significance level (p < 0.05). Gender (b = 0.69, beta coefficient = 0.38, t = 0.72, p = 0.40), religion (b = 0.56, beta coefficient = 0.70, t = 1.37, p = 0.11), ethnic group (b = 0.00, beta coefficient = 0.01, t = 0.13, p = 0.41), and school type (b = 0.14, beta coefficient = 0.07, t = -0.15, p = 0.43) do not show statistically significant relationships with mathematics achievement. However, parents’ education (b = 0.13, beta coefficient = 0.11, t = 0.31, p = 0.01) demonstrates a statistically significant positive relationship with math achievement, suggesting that higher levels of parental education may be associated with slightly higher math achievement scores in students. Overall, the results of the regression analysis indicate that parents’ education shows a statistically significant relationship with math achievement, while the other variables (gender, religion, ethnic group, and school type) do not have significant effects on math achievement in this study. Mathematics Achievement: A significant proportion of students in Kailali demonstrated below-average achievement in mathematics, as reflected in the SEE 2078 exam results for both the sample and the broader population. The majority of study participants (60.71%) received an E grade, with minimal representation in higher grades like A+ (0.78%) and a (1.03%). This trend was consistent in the population over four years of data, indicating ongoing challenges in achieving high levels of mathematics achievement at the secondary level. Attitude and Mathematics Achievement: The study found a statistically significant relationship between students’ attitudes towards mathematics and their achievement (p < 0.05), with a positive correlation coefficient of 0.36. Students with more positive attitudes tended to perform better in mathematics, with a moderate effect size (Cohen’s d = 0.32). Descriptive statistics shows that students generally held favorable views towards mathematics, with an overall mean attitude score of 4.06 and SD 0.01 on a 5-point Likert scale. Statement such as “Mathematics is a very worthwhile and necessary subject” and “Learning mathematics skills is important for the future” received high mean rating of 4.17 and 4.21 respectively. These findings suggest that fostering positive attitudes towards mathematics can enhance students’ academic achievement. Anxiety and Mathematics Achievement: The study found a significant negative correlation between students’ mathematics anxiety and their achievement, with a Pearson correlation coefficient of -0.47 (p < 0.05). This indicates that higher levels of mathematics anxiety were associated with lower achievement. Students reported moderate levels of anxiety across various situations, such as preparing for mathematics tests (mean score = 3.30) and self-assessing their abilities (mean score = 3.43). The overall mean anxiety score was 3.41 (SD = 1.31). These findings parallel existing research, demonstrating that anxiety hinders cognitive processing and problem-solving, thereby reducing mathematics achievement. The results suggest that interventions aimed at reducing mathematics anxiety could positively affect students’ mathematics achievement. Sociodemographic Factors and Mathematics Achievement: The study showing no statistically significant differences in mathematics achievement based on gender, ethnic background, religion, or school type. Although females exhibited slightly higher levels of anxiety, this did not significantly affect their achievement. Similarly, ethnic group and religion had minimal influence on achievement, with small effect sizes (η² = 0.024 and Cohen’s d = 0.22, respectively). However, parental education emerged as a significant factor, with students whose parents had attended university or higher education achieving better results than those with less-educated or illiterate parents (p < 0.05). The effect size for parental education (η² = 0.104) indicated a moderate impact, highlighting the importance of parental education in shaping students’ academic success. This suggests that parental educational attainment plays a key role in providing academic support and resources, ultimately influencing students’ mathematics achievement. The regression analysis showed that students’ attitudes towards mathematics (b = -0.28, p = 0.01) and mathematics anxiety (b = -0.13, p = 0.03) were significant predictors of mathematics achievement, with negative relationships indicating that more positive attitudes and lower anxiety levels were associated with higher achievement. Among the sociodemographic factors, parental education (b = 0.13, p = 0.01) also showed a statistically significant positive relationship with mathematics achievement, suggesting that students with better-educated parents tend to perform slightly better in mathematics. However, other factors such as gender, religion, ethnic group, and school type did not show significant effects on mathematics achievement in this study (p > 0.05). This shows the importance of psychological factors and parental education in students’ academic achievement. In terms of achievement, this study shows that the majority of students achieved the C+ to E grade range in SEE 2078 exam results, indicating a significant proportion of students achieved below average in mathematics. A comparison with district-level mathematics achievement data showed the overall degree of difficulty of the achievement in SEE, with the data corresponding to the achievement levels among study participants. This pattern of low mathematics achievement is consistent with other research like Vertex Consult Pvt. Ltd. (2014), which underlines the long-term nature of mathematics difficulties among students of all ages, in particular at the secondary level [21,22]. Curriculum design, approaches to learning, and the effects of attitude and anxiety towards mathematics are all factors that can contribute to such difficulties [23, 24]. The research emphasizes the importance of targeted support and improving pedagogical approaches in school settings [25, 26]. The t-test’s significant p-value (p <0.05) and positive correlation coefficient of 0.36 indicate the significant relationship between attitude and achievement in mathematics, which has consistently shown that students with more positive attitudes towards mathematics tend to achieve higher achievement scores [27,28]. Furthermore, students with a positive attitude towards mathematics achieved significantly higher achievement scores compared to those with a negative attitude. Cohen’s d = 0.32 shows a moderate effect size, which signifies a meaningful effect size on achievement in mathematics. These results are consistent with studies by [29] and [30] emphasizing that fostering positive attitudes towards mathematics can lead to improved mathematics achievement. Research shows that people with a positive attitude towards mathematics are more likely to approach the subject with confidence and enthusiasm [31, 32]. This positive mindset can promote a willingness to engage in challenging mathematics tasks and seek help when needed, fostering a more conducive learning environment. Individuals who have a positive perception of mathematics are likely to use effective study strategies and develop a growth mindset [33], believing that their abilities can be developed through effort and practice. A positive attitude toward mathematics is often associated with higher achievement and better performance [34]. Students who have experienced success and positive reinforcement in mathematics are more likely to develop a positive attitude and enhanced self-efficacy in their mathematical abilities [35]. Shifting the focus to mathematics anxiety, the study showed that a large number of students experienced anxiety toward mathematics. This emotional aspect is critical to address as it significantly affects the achievement of mathematics [36, 37]. The study identifies aspects of mathematics anxiety, such as stress physical responses (the heart skipping a beat) and irritation related to mathematics activities that exhibit a significant relationship with achievement in mathematics in the SEE result. The mathematics anxiety affects one physically and emotionally, impacting one’s cognitive abilities and, subsequently, academic performance [38]. The findings showed that preparation for mathematics tests, self-assessment of mathematics ability, taking exams, and receiving final grades demonstrated significant associations. Furthermore, based on the characteristics of the research sample, the discussion of the findings concerning gender, school type, religion, ethnic group, and parental education provide information on the linkages and their consequences within the context of existing literature. The investigation found statistical insignificance in mathematics achievement based on gender. However, Cohen’s d-effect size of 0.29 showed a minor effect size, and females exhibited higher levels of mathematics achievement compared to males. These findings, consistent with earlier studies, suggest the absence of significant gender-related gaps, with observed differences being relatively small [39,40]. Shifting the focus to the influence of ethnic groups, the research findings expose an insignificant relationship between students’ mathematics achievement and their ethnic background. The effect size (η2) is 0.024, suggesting that a minimal fraction of the variance in mathematics achievement can be attributed to differences in ethnic groups. Concerning religious affiliation, the study indicated a statistically insignificant disparity of achievement in mathematics between Hindu and non-Hindu students, with a minimal effect size (Cohen’s = 0.22), indicating a minor divergence of mathematics achievement between two groups (Hindu and non-Hindu). However, this did not achieve statistical significance. The relationship between religion and mathematics achievement is multifaceted, with cultural and social norms influencing students’ perceptions. Educational resources and familial expectations, which may vary across religious backgrounds, play a significantly role in shaping students’ mathematics achievement [41]. In this study, there was no statistically significant relationship between religion and mathematics achievement (p > 0.05). However, Cohen’s d was 0.22, which indicates a small effect size. Certain religious teachings may emphases values such as resilience, personal growth, and detachment from worldly concerns, which can shape students’ attitudes toward academic challenges and influence their mathematics achievement [42]. The study’s analysis of the achievement in mathematics status of tenth-grade students in Kailali supports the deficit theory. The data show a high percentage of students scoring poorly in mathematics, reflecting a low level of mathematics achievement in the SEE 2078 exam results and other 4-year results. This is the same as the deficit theory’s claim that low achievement in mathematics can contribute to mathematics anxiety [43]. The study found that a significant proportion of participants experienced some degree of anxiety in mathematics. The average mathematics anxiety score and its distribution across various demographic variables suggest that a substantial number of students grapple with mathematics anxiety. This aligns with the deficit theory’s emphasis on the role of individual cognitive limitations in fostering mathematical anxiety [43]. This study established a statistically significant relationship between positive attitudes related to mathematics and higher achievement in mathematics, consistent with deficit theory’s assertion that attitudes towards mathematics can influence academic performance [44]. Furthermore, the deficit theory’s essence corresponds to the idea that disparities in achievement outcomes are influenced by factors beyond mere individual ability, including sociocultural elements [38]. AGT does not directly address sociodemographic factors, but it does give a framework for how students’ motivation and achievement goals can mediate the link between these variables. The analysis of gender showed an insignificant difference in achievement in mathematics between male and female students; girls tended to exhibit somewhat greater levels of anxiety in mathematics. This study showed that students whose parents had attained education at the campus or university level had a lower level of anxiety in mathematics compared to those with illiterate or literate parents. These findings support the importance of individual differences, attitudes, and expectations in shaping motivation and achievement goals [39]. The study emphasizes the need for educators to create mastery-oriented classrooms that value effort, growth, and skill development. These practices can positively influence students’ attitudes about mathematics and reduce mathematics anxiety, consistent with AGT’s principles.
- CONCLUSION
This study, conducted within the positivist philosophical paradigm, aimed to explore the status of tenth-grade students’ attitudes and anxiety towards mathematics and their effects on the achievement of mathematics in secondary schools in the Kailali district of Sudur paschim province, Nepal. A specially designed questionnaire was employed to assess the level of attitude and anxiety towards mathematics, while the national board exam SEE result of 2078 BS, administered by the National Examinations Board office of the Controller of the Examination, grade 10, was used to analyses the achievement in mathematics. The research used a multi-stage cluster sampling strategy to select a sample of 387 students from eight schools. The collected data was analyzed using SPSS software. The findings revealed a substantial relationship between attitudes, anxiety, and achievement in mathematics in the SEE 2078 BS exam. A significant proportion of students achieved low grades in mathematics, supporting the deficit theory, which claims that poor mathematics achievement can contribute to mathematics anxiety. The study found a significant correlation between mathematics anxiety and mathematics achievement, with higher mathematics anxiety linked to lower achievement, consistent with existing research. Students who have higher levels of mathematics anxiety can have an effect on their academic achievement. So, the relationship between mathematics anxiety and achievement was statistically significant, including factors such as preparing for mathematics tests, perceptions of mathematical competence, and reactions to receiving final grades. Positive attitudes towards mathematics, such as valuing the subject and recognizing its importance, were linked to higher achievement, underscoring the potential effect of fostering positive perceptions of mathematics on students’ achievement. Furthermore, the study analyses a significant correlation between students’ attitudes towards mathematics and their achievement in mathematics. Students with positive attitudes achieved higher achievement scores in mathematics than those with negative attitudes, in line with AGT. This theory emphasizes the importance of perceptions, values, and expectations in shaping academic motivation and achievement goals. The analyses also show that sociodemographic factors such as gender, school type, religion, and ethnic group do not significantly influence mathematics achievement, although small differences were observed. However, parental education was found to have a moderate effect on anxiety about mathematics, with students whose parents had attained higher levels of education experiencing lower levels of mathematics anxiety. This study suggests the necessity of a comprehensive strategy to enhance mathematics achievement among tenth-grade students in Kailali. By addressing both psychological and socio-demographic factors, it can cultivate a more effective learning environment. The significant correlation between students’ attitudes and their mathematics achievement underscores the importance of fostering positive beliefs and expectations, which are essential for academic motivation. Additionally, the study exposes that mathematics anxiety significantly hinders achievement; thus, implementing interventions such as mindfulness training and increasing parental involvement can help alleviate this anxiety and build student confidence. Moreover, emphasizing self-efficacy and a mastery-oriented approach characterized by clear goal-setting, timely feedback, and a growth mindset can further empower students. Recognizing the effect of socio-demographic factors, especially parental education, is crucial in addressing the challenges faced by diverse student backgrounds. By providing tailored support to underprivileged students, educators and policymakers can help bridge the achievement gap. Ultimately, a multi-faceted approach that integrates these elements can create a more conducive learning environment, enabling students to excel in mathematics and fostering long-term mathematics and then academic achievement.
REFERENCES
- Akey, T. M. (2006). School context, student attitudes and behaviour, and academic achievement: an exploratory analysis. MDRC.
- Alexander, L., & Martray, C. (1989). The development of an abbreviated version of the mathematics anxiety rating scale. Measurement and Evaluation in Counseling and Development, 22(3), 143-150.
- Alkan, V. (2018). A systematic review: ‘Mathematics Anxiety’ in Tukey. International Journal of Assessment of Assessment Tools in Education, 567-592.
- Ashcraft, M. H., & Kirk, E. P. (2001). The relationships among working memory, mathematics anxiety, and performance. Journal of Experimental Psychology: General, 130(2), 224–237.
- Beilock, S. L., & Willingham, D. T. (2014). Math Anxiety: Can teachers help students reduce it? Ask the cognitive scientist. American Educator, 38(2), 28.
- Belbase, S. (2013). Images, anxieties, and attitudes toward mathematics. International Journal of Education in Mathematics, Science, and Technology, 1(4), 230–237.
- Carey, E., Hill, F., Devine, A., & Szücs, D. (2016). The chicken or the egg? The direction of the relationship between mathematics anxiety and mathematics performance. Frontiers in Psychology, 6.
- Casty, M. M., Ciriaka, M. G., & Peter, R. (2021). Mathematics anxiety, attitude, and performance among secondary school students in Kenya. Educational Research and Reviews, 16(6), 226–235.
- Catalano, M. (2014). Review of The Joy of x: A guided tour of mathematics, from one to infinity by Steven Strogatz. Numeracy, 7.
- Center for Education and Human Resource Development (CEHRD), (2021/22). Flash report 2078 (2021/22). Bhaktapur: Author.
- Chazan, D., Pelletier, G., & Daniels, L. (2021). Achievement goal theory review: an application to school psychology. Canadian Journal of School Psychology, 37, 082957352110583.
- Cockcroft, J., Saigar, M., Dawkins, A., & Rutland, C. (2021). Why do we need mathematics in medicine? Frontiers for Young Minds, 9.
- Cohen, J. (1988). Statistical power analysis for the behavioral sciences (2nd ed). L. Erlbaum Associates.
- Education Curriculum 2078 (Grades 9–10) (Nepali version). Ministry of Education, Science and Educatio
- Dénes, S. (2020, June 18). What is mathematics anxiety?
- Department of Education (DOE), (2017). Education in Figures 2017.
- Devlin, K. (2000). The mathematics gene: How mathematical thinking evolved and why numbers are like gossip. Oxford University Press.
- Gunderson, E., Park, D., Maloney, E., Beilock, S., & Levine, S. (2017). Reciprocal relations among motivational frameworks, mathematics anxiety, and mathematics achievement in early elementary school. Journal of Cognition and Development, 19.
- Hanchon, T. A. (2011). Examining perfectionism through the lens of achievement goal theory. North American Journal of Psychology, 13(3), 469-490.
- Hembree, R. (1990). The Nature, Effects, and Relief of Mathematics Anxiety. Journal for Research in Mathematics Education, 21(1), 33–46. https://doi.org/10.2307/749455
- Johanson, G. A., & Brooks, G. P. (2010). Initial scale development: Sample size for pilot studies. Educational and Psychological Measurement, 70(3), 394–400.
- Kenjayeva, S.I. (2023). Methods for developing students’ mathematical thinking skills in schools. Journal of Pedagogical Inventions and Practices, 20, 110–114. https://zienjournals.com/index.php/jpip/article/view/4044
- Kunwar, R. (2020b). Impact of parental education and their occupation on mathematics achievement of secondary level students in Nepal. An Interdisciplinary Peer Reviewed Journal, VI.
- Macmull, M. S., & Ashkenazi, S. (2019). Mathematics anxiety: The relationship between parenting style and mathematics self-efficacy. Frontiers in Psychology, 10.
- McLeod, D. B. (1992). Research on affect in mathematics education: A reconceptualization. In Handbook of research on mathematics teaching and learning: A project of the National Council of Teachers of Mathematics (575–596). Macmillan Publishing.
- (2020). Principles to actions: Ensuring mathematical success for all. National Council of Teachers of Mathematics, Incorporated.
- Odiri E. O. (2022). Students’ self-belief about their mathematics capability and achievement in mathematics. Innovations, 65, 288–298.
- (2019). PISA 2018 results (Volume II): Where all students can succeed. OECD.
- Regmi, N. (2016). Mathematical anxiety among secondary level girls’ students [Master’s Degree Thesis, Tribhuvan University].
- Reyes, L. H. (1984). Affective Variables and Mathematics Education. The Elementary School Journal, 84(5), 558–581.
- Mathematics students’ experiences. AIP Conference Proceedings, 1905(1), 050039. https://doi.org/10.1063/1.5012258
- Scarpello, G. (2007). Helping students get past mathematics anxiety. Techniques: Connecting education & careers, 82(6), 34–35.
- Stevens, E. A., Rodgers, M. A., & Powell, S. R. (2018). Mathematics interventions for upper elementary and secondary students: A meta-analysis of research. Remedial and Special Education, 39(6), 327–340.
- Shrestha, B. (2017). Religious Ethics and Social Responsible Behaviors of Small Firms in Nepal. Journal of Religion and Business Ethics, 3, 1–18.
- Shrestha, R. D., Luitel, B. C., & Belbase, S. (2021). Underachieving students’ mathematical learning experience in the classrooms in Nepal. Contemporary Mathematics and Science Education, 2(2), ep21010.
- Siebers, W. M. (2015). Relationship between mathematics anxiety and student achievement of middle school students [PhD Thesis, Colorado State University].
- Tewell, E. (2020). The Problem with Grit: Dismantling Deficit Thinking in Library Instruction. Portal: Libraries and the Academy, 20(1), 137–159.
- Trent, S. C., Artiles, A. J., & Englert, C. S. (1998). From Deficit Thinking to Social Constructivism: A Review of Theory, Research, and Practice in Special Education. Review of Research in Education, 23, 277.
- Tobias, S. (1993). Overcoming mathematics anxiety (Revised & Expanded edition). W Norton & Co Ltd.
- Treece, E. M. W., & Treece, J. W. (1982). Elements of research in nursing (3rd). Mosby.
- Trujillo, K., & Hadfield, O. D. (1999). Tracing the roots of mathematics anxiety through in-depth interviews with preservice elementary teachers. College Student Journal, 33, 219–219.
- Ural, A. (2015). An investigation of high school students’ mathematics fears according to some variables. In International J. Soc. Sci. & Education.
- (2018). Education 2030: Incheon declaration and framework for action for the implementation of sustainable development goal 4.
- Vertex Consult Pvt. Ltd. (2014). Status of SLC dropouts and identifying ways to engage students in co-curricular activities, Final Report. Department of Education
Publication History
Submitted: July 23, 2025
Accepted: August 11, 2025
Published: August 31, 2025
Identification
D-0515
DOI
https://doi.org/10.71017/djsi.4.08.d-0515
Citation
Bhumi Prasad Shrma (2025). Effect of Students’ Attitude and Anxiety on Mathematics Achievements in the Schools of Kailali. Dinkum Journal of Social Innovations, 4(08):603-619.
Copyright
© 2025 The Author(s).