

")
Publication History
Submitted: July 23, 2025
Accepted: August 11, 2025
Published: September 30, 2025
Identification
D-0492
DOI
https://doi.org/10.71017/djmi.4.9.d-0492
Citation
Sarjan Shrestha & Amrita shrestha (2025). Dyslipidemia in Patients with Type 2 Diabetes Mellitus Attending Bir Hospital, NAMS, Nepal. Journal of Medical Innovations, 4(09):587-603.
Copyright
© 2025 The Author(s).
587-603
Dyslipidemia in Patients with Type 2 Diabetes Mellitus Attending Bir Hospital, NAMS, NepalOriginal Article
Sarjan Shrestha 1*, Amrita shrestha 2
- Department of Internal Medicine, National Academy of Medical Sciences (NAMS), BIR Hospital, Kathmandu, Nepal.
- Nepalgunj Medical College(NGMC),Kolhapur, Nanke, Nepal.
* Correspondence: sarjans055@gmail.com
Abstract: Diabetes mellitus (DM) refers to a group of common metabolic disorders that share the phenotype of hyperglycemia. Depending on the etiology of the DM, factors contributing to hyperglycemia include reduced insulin secretion, decreased glucose utilization, and increased glucose production. This study identified the biochemical characteristics (FPG, PPBS, HbA1C, HDL-C, LDL-C, TC, TG) in patients with type 2 DM and prevalence of dyslipidemia in patients with type 2 DM based on age and sex. This is a cross-sectional study carried out among 54 patients with type 2 diabetic mellitus and dyslipidemia attending OPD and IPD of Bir hospital. Out of the 54 types 2 DM patients with dyslipidemia studied, 32 (59.3%) were male and 22 (40%) were female. Mean age of study subjects was 63.87±12.15. Majority (53.7%) of them were in age group of 45-59 year. Mean FPG (207.50±74.57), PPBS (314.34±102.27), HbA1C (9.29±2.46) in male subjects were higher than that of (FPG=194.09±59.57, PPBS=271.56±71.01, HbA1C=9.28±2.65) in female. Prevalence of dyslipidemia is more common in male population (59.26%) as compared to female population (40.74%). Age group of 45-59 yrs. had high prevalence of dyslipidemia (53.7%) in which male was again affected more (31.40%) as compared to female (22.22%). Most common combined two parameter dyslipidemia was high LDL and high TG (44.82%) and high TG and low HDL (44.82%). %. High prevalence of dyslipidemia in type 2 DM patients was observed among male subjects and age group of 45-59 year. Most common lipid abnormality found was combined two parameter dyslipidemia in which male were affected more with (high LDL and high TC) and commonly seen in age group of 45-59 year with (high LDL and high TC). Most common isolated single parameter dyslipidemia observed in male was high TG and that observed in female was low HDL. Among poor glycemic control patient’s major lipid abnormality was high TG followed by low HDL. No significant relationship was found between HbA1c and any of the lipid parameters.
Keywords: dyslipidemia, type 2 diabetes mellitus, hospital, NAMS, Nepal, prevalence
- INTRODUCTION
The term “dyslipidemia” is increasingly being used to describe abnormal changes in lipid profile, replacing the old term “hyperlipidemia”. Dyslipidemia encompasses changes in HDL-cholesterol (HDL-C), the size and density of LDL- cholesterol (LDL-C) and the total cholesterol/ HDL-C ratio (TC/HDL-C) [1]. The term diabetic dyslipidemia comprises a triad of raised triglycerides, reduced HDL-C and excess of small, dense LDL particles. Dyslipidemia was defined according to the third report of National Cholesterol Education Program Adult Treatment Panel (NCEP ATP III) criteria: [2] serum TC level ≥200 mg/dl; serum TG level ≥150 mg/dl; HDL-C level ≤40 mg/dl for both men and women; LDL-C level ≥100 mg/dl non-HDL-C ≥ 130 mg/dl. Diabetes mellitus (DM) refers to a group of common metabolic disorders that share the phenotype of hyperglycemia. Depending on the etiology of the DM, factors contributing to hyperglycemia include reduced insulin secretion, decreased glucose utilization, and increased glucose production [4]. Type 2 diabetes mellitus (T2DM) is the third major non communicable disease in Nepal, and is approaching pandemic levels due to rapid change in socioeconomic status and life-style of the people [5]. T2DM amplifies the risk of cardiovascular disease (CVD) several fold, making it a significant risk factor of the latter. More than 50% patients with T2DM die due to coronary heart disease (CHD) [6,7]. Among several modifiable and non-modifiable risk factors for CVD, T2DM is the strongest, as it is strongly associated with atherogenic dyslipidemia [1,2]. Patient were designated as to having type 2 diabetes when plasma glucose levels above the cut off values recommended by ADA guideline [1]: FPG≥126mg/dl, (7.0 mmol/L). Fasting is defined as no caloric intake for at least 8 h or 2-h PG ≥200 mg/dL (11.1 mmol/L) during OGTT or HbA1C ≥ 6.5% (48 mmol/mol) or in a patient with classic symptoms of hyperglycemia or hyperglycemic crisis, a random plasma glucose ≥200 mg/dL (11.1 mmol/L). The dyslipidemia in diabetic patients results from insulin deficiency or resistance that promotes lipolysis in the visceral adipocytes and increases the flux of free fatty acids in plasma and liver. Moreover, the activity of an endothelial enzyme, lipoprotein lipase, also decreases. These conditions lead to hepatic steatosis, over-secretion of larger triglyceride (TG)-rich very low-density lipoprotein 1(VLDL1) particles into the plasma, over-secretion of hepatic apolipoprotein B (ApoB), impaired clearance of chylomicrons and decreased receptor mediated endocytosis in the liver [7,8]. The most common phenotypic pattern of diabetic dyslipidemia involves lipid triad with raised triglycerides, reduced high density lipoprotein cholesterol (HDL-C) and increased concentration of small, dense low density lipoprotein cholesterol (LDLC) particles [1,2]. Additionally, total cholesterol (TC)/ HDL-C ratio, non-HDL-C and ApoB have also been shown to be directly involved in the atherogenic process and development of CVD. Diabetic dyslipidemia has therefore emerged as an important biomarker for the increased CVD risk observed in diabetic patients. Significant reduction of CVD related morbidity and mortality by lipid-lowering agents such as statins underscores their importance in the cardiovascular health of diabetic patients [4]. Therefore, early detection and aggressive management of dyslipidemia are very important in saving the lives of diabetic patients from atherogenic cardiovascular disease. Recent year there is research done in the Western hilly region of Nepal which is mostly populated by ethnic groups like Gurung, Magars and Dalits which differentiates this population genetically from other areas of Nepal. The socioeconomic status, life-style, dietary habit and cultural practices of these ethnic groups make them more vulnerable to high incidence of CVD than any other ethnic groups in this region. This hospital-based studies h shows that the prevalence of metabolic syndrome and cardiovascular disease is very high in this region particularly among these three ethnic groups [7,8]. Atherogenic dyslipidemia is a major modifiable risk factor of CVD. However, no systematic study has been carried out so far in this region to map the actual epidemiology of CVD risk factors including the dyslipidemia. Given that the prevalence and pattern of CVD risk factors differ according to geographic location, ethnicity, dietary habits and socio-economic status of the population under study, we hypothesize that epidemiology of dyslipidemia is different for the population of this region compared to others. Our study thus aims to describe the prevalence, pattern and independent predictors of dyslipidemia among type 2 diabetic patients attending at Bir hospital
- MATERIALS & METHOD
This is a hospital based descriptive, cross sectional prospective study done at NAMS, Bir Hospital, and Kathmandu, Nepal for a period of 1 year. Patients visited in opd, ward and ER under NAMS with history of type 2 DM with dyslipidemia after obtaining informed consent. Using formula for sample size calculation:
Sample size (n) = z2 p (1-p)/e2
where,
n = required sample size
Z= Statistics for level of confidence (for 95% level of significance, Z= 1.96)
P= Prevalence of dyslipidemia in type2 DM cases (0.853)
e=Precision or maximum tolerable error =10%
Z = z deviate corresponding to desired reliability level (1.96) for 95% reliability
Sample size = 1.962 *0.853(1-0.853)/0.12
= 48
Considering 10% dropout, total of 54 patient will be studied in the study. Convenient sampling technique will be used. All patients who are attending opd, ward, emergency in BIR hospital with diagnosis of type 2 diabetes mellitus fulfilling the inclusion criteria will be enrolled during the study period till the required sample size is met. Data were collected using structured proforma. The denovo prepared questionnaires were initially be pre tested and analyzed on ten subjects to establish the feasibility of study and were reset if necessary. Five ml venous blood was drawn from each subject in morning after overnight (≥8 h) fasting and then divided into fluoride-oxalate, ethylene diamine tetraacetate (EDTA) and plain test tubes. All direct biochemical measurements were made using automated chemistry analyzer and ready-to-use reagent kits according to the standardized protocols provided by the manufacturers (Erbachem XL-300, Germany). All tests were run in duplicate and appropriate standards and quality control sera were used to ensure the accuracy of the measurements. Fasting glucose was measured in fluoridated plasma by glucose oxidase/peroxidase method. TC and TG were estimated by cholesterol oxidase/peroxidase and glycerol phosphate kinase methods, respectively. HDL-C was measured by phosphotungstate precipitation method. The value of LDL-C was calculated using Friedwald formula. Non-HDL-C was calculated by subtracting HDL-C from TC. Glycated hemoglobin (HbA1c) was measured on EDTA blood by ion-exchange resin method. Comparison was also made of the lipid levels in patients with good control of diabetes (HbA1c<7%) with those having poor glycemic control (HbA1c≥7%) [3].Dyslipidemia in type 2 DM patients are grouped according to combined two parameter dyslipidemia and isolated single parameter dyslipidemia [20]: Combined two parameter dyslipidemia: Group A: ( LDL >= 100, TG>=150& HDL >40/50), Group B: (LDL<100, TG>=150& HDL< 40/50), Group C: (LDL>=100, TG <150 & HDL<40/50). Isolated single parameter dyslipidemia: Group I: (LDL>=100, TG <150, HDL >40/50), Group II: (LDL<100, TG>=150, HDL>40/50), Group III: (LDL<100, TG<150 & HDL<40/50). Collected data were entered in and analyzed using statistical software IBM-SPSS (Statistical Package for Social Sciences) version 25.0. Analyzed data were presented as frequencies and percentages for categorical variables. Continuous variables with symmetrical distribution were expressed as means ± standard deviation Analyzed data were presented in the form of tables, graphs and charts. Chi square test and student t test were used to test alternate and null hypothesis. In alternate hypothesis, there is an association of dyslipidemia with type 2 DM. In null hypothesis, there is no association of dyslipidemia with type 2 DM. P value less than 0.05 will reject null hypothesis. An approval for the study was obtained from institutional review board ethics committee. Before including the patient in study, all patients were well informed and both written and verbal consent will be taken. All patients were thoroughly examined. Patients contained the right to refuse to be involved in the study after all the information. Complications if any during the study period were managed as per the standard hospital protocol.
- RESULTS & DISCUSSION
Table 01: Age distribution of participants
| Age group (year) | Gender | Percentage (%) | |
| Male (n=32) | Female(n=22) | ||
| 30-44 | 5 (9.26%) | 5 (9.26%) | 18.5 |
| 45-59 | 17 (31.48%) | 12 (22.22%) | 53.7 |
| 60-75 | 10 (18.52%) | 5 (9.26%) | 27.8 |
Table 02: Sex distribution of participants
| Gender | Frequency (n=54) | Percent (%) |
| Male | 32 | 59.3 |
| Female | 22 | 40.7 |
Table 03: Characteristics of Study population
| Variables | MALE (n: 32) | FEMALE (n: 22) | P value |
| Mean ± SD | Mean ± SD | ||
| Age | 54.34± 12.09 | 53.68±13.58 | 00.00b |
| Fating plasma glucose (mg/dl) | 207.50±74.57 | 194.09±59.57 | 0.485a |
| HbA1c (%) | 9.29±2.46 | 9.28±2.65 | 0.987a |
| Postprandial blood sugar (mg/dl) | 314.34±102.27 | 271.56±71.01 | 0.095a |
| TC | 166.97±69.80 | 183.50±68.43 | 0.393a |
| TG | 195.47±90.23 | 233.55±128,32 | 0.206a |
| LDL-C | 98.91±48.52 | 93.77±44,89 | 0.695a |
| HDL-C | 39.50±14.01 | 40.91±13.88 | 0.717a |
a Independent sample t-test, b Chi-Square test
Table 04: Prevalence of dyslipidemia in patients with type 2 DM based on age and sex
| Age (yrs.) | Dyslipidemia | P value | |
| Male (n=32) | Female (n=22) | 0.704 | |
| 30-44 | 5 (9.26%) | 5 ((9.26%)) | |
| 45-59 | 17 (31.48%) | 12 (22.22%) | |
| 60-75 | 10 (18.52%) | 5 (9.26%) | |
Table 05: pattern of dyslipidemia in patients with type 2 DM on the basis of sex
| Pattern of dyslipidemia | MALE (n =32) | FEMALE (n =22) | Total | P value |
| Mixed dyslipidemia
|
8 (88.89%) | 1 (11.11%) | 9 (16.66%) | |
| Combined two parameter dyslipidemia
Group A Group B Group C |
15 (51.72%) | 13 (44.82%) | 29 (53.7%) | 0.670 |
| 8 (27.59%) | 5 (17.24%) | 13 (44.82%) | ||
| 6 (20.69%) | 7 (24.14%) | 13 (44.82%) | ||
| 2 (6.90%) | 1 (3.45%) | 3 (10.34%) | ||
| Isolated single parameter dyslipidemia
Group I Group II Group III |
10 (62.50%) | 6 (37.5%) | 16 (29.52%) | 0.315 |
| 0 | 0 | 0 | ||
| 3 18.75%) | 6 (37.50%) | 9 (56.25%) | ||
| 5 (31.25%) | 2 (12.50%) | 7 (43.75%) |
Table 06: pattern of dyslipidemia in patients with type 2 DM on the basis of age
| Pattern of dyslipidemia | AGE (yrs.) | total | P value | ||
| 30-44
n=10 (%) |
45-59
N=29 (%) |
60-75
N=15 (%) |
|||
| Combined two parameter dyslipidemia
Group A Group B Group C
|
9 (31.03%) | 13 (44.82%) | 7 (24.13%) | 29(53.7%) | 0.493 |
| 3 (10.34%) | 7 (24.14%) | 3 (10.34%) | 13(44.8%) | ||
| 6 (20.69%) | 4 (13.79%) | 3 (10.34%) | 13(44.8%) | ||
| 0 | 2 (6.90%) | 1 (3.45%) | 3 (10.34%) | ||
| Isolated single parameter dyslipidemia
Group I Group II Group III |
10 (62.5%) | 6 (37, 5%) | 16 (29.62%) | 0.633 | |
| 0 | 0 | 0 | 0 | ||
| 0 | 5 (31.25%) | 4 (25%) | 9 (56.25%) | ||
| 0 | 5 (31.25%) | 2(12.50%) | 7 (43, 75%) | ||
| Mixed dyslipidemia | 1 (11.11%) | 6 (66.67%) | 2 (22.27%) | 9(16.66%) | 0.00 |
Table 07: The Pattern of dyslipidemia in relation with glycemic status (HbA1C level) of patients with type 2 DM
| Lipid level | HbA1C<7(patient)
n =8 (%) |
HbA1C≥7(patient)
n =48 (%) |
Total | P value | |
| TC | Normal
High |
4 (7.41%)
4 (7.41%) |
32 (59.25%)
14 (25.93%) |
36 (66.66%)
18 (33.34%) |
0.418 |
| TG | Normal
High |
4 (7.41%)
4 (7.41%) |
10 (18.52%)
36 (66.67%) |
14 (25.92%)
40 (74.07%) |
0.183 |
| LDL-C | Normal
High |
3 (5.56%)
5 (9.26%) |
28 (51.85%)
18 (33.33%) |
31 (57.40%)
23 (42.59%) |
0.264 |
| HDL-C | Normal
low |
5 (9.26%)
3 (5.56%) |
20 (37.04%)
26 (48.15%) |
25 (46.29%)
29 (53.70%) |
0.448 |
As given in table 1, among total 54 type 2 DM patients enrolled in the study, majority of patients, 29 (53.7%) were in age group of 45-59 year. Among them, 17(31.4%) were male and 12 (22.22%) were female in age group of 45-59yr.Mean age of the study population was 53.87±12.15.
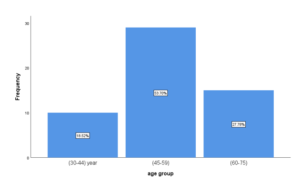
Figure 01: Age Distribution in patients with type 2 DM
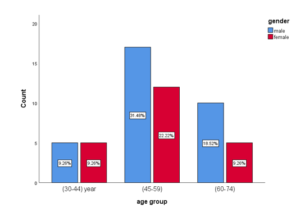
Figure 02: Age distribution in relation to sex in patients with type 2 DM
As given in table 2, majority of the patients were male 32(58.3%) when compared to females 22(40.7%).
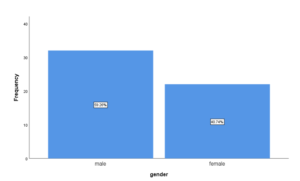
Figure 03: Sex distribution in patients with type 2 DM
Mean age of male population in study group is 54.34±12.09 and female study group is 53.68±13.58. There was no statistically significant difference observed between them. Mean FPG of male population in study group is 207.50±74.57 and that of female population is 194.09±59.57. There was no statistically significant difference in mean FPG between male and female group as p value is 0.485. Mean PPBS of male population in study group is 314±102.27 and that of female population is 271.56±71.01. There was no statistically significant difference in mean PPBS between male and female group as p value is 0.095. Mean HbA1C of male population in study group is 9.29±2.46 and that of female population is 9.28±2.65. There was no statistically significant difference in mean HbA1C between male and female group as p value is 0.987. Mean total cholesterol of male population in study group is 166.97±69.80 and that of female population is 183.50±68.43. There was no statistically significant difference in mean TC between male and female group as p value is 0.393. Mean triglyceride of male population in study group is 195.47±90.23 and that of female population is 233.55±128.32. There was no statistically significant difference in mean TG between male and female group as p value is 0.206. Mean total LDL-C of male population in study group is 98.91±48.52 and that of female population is 93.77±44.89. There was no statistically significant difference in mean LDL-C between male and female group as p value is 0.695. Mean HDL-C of male population in study group is 39.5±4.01 and that of female population is 40.91±13.88. There was no statistically significant difference in mean HDL-C between male and female group as p value is 0.717. As given in table 4, among total 54 type 2 DM patient, 10, 29, 15 were dyslipidemia in age group of 30-44yr, 45-59yr, 60-75yr respectively. Among them 5(9.26%),17(31.40%),10(18.52%) was found to have dyslipidemia in male population of age group of 30-44 yrs., 45- 59 yrs., 60-75yr respectively. Similarly, 5(9.26%),12(22.22%),5(9.26%) was found to have dyslipidemia in female population of age group of 30-44 yrs., 45- 59 yrs., 60-75yr respectively. So, prevalence of dyslipidemia was more common in 45- 59-year age group of both male and female subjects. Male (59.26%) were commonly affected in comparison to female (40.74%). There was no statistically significant difference in prevalence of dyslipidemia in patients with type 2 DM between male and female group as p value is 0.704.
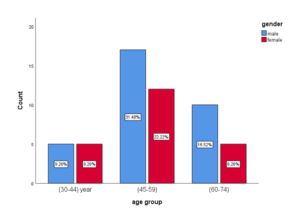
Figure 04: Prevalence of dyslipidemia in patients with type 2 DM based on age
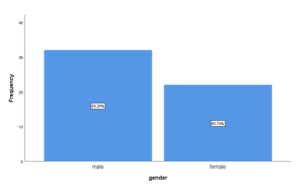
Figure 05: Prevalence of dyslipidemia in patients with type 2 DM based on sex
Most common pattern of dyslipidemia observed was combined two parameter dyslipidemia (53.7%). Among them, equal study subjects (44.82%) had high LDL / high TG and high TG / low HDL. Male subjects (27.59%) had high LDL / high TG in comparison to female subjects (24.14%) who had high TG and low HDL There was no statistically significant difference as p value is 0.670.
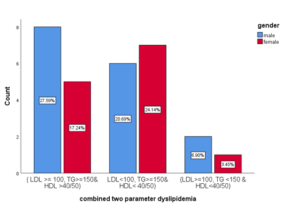
Figure 06: Combined two parameter dyslipidemia in patients with type 2 DM on the basis of sex
Among 54 type 2 DM patients, 16 patients (29.52%) were having isolated single parameter dyslipidemia in which majority were male (62.50%) in comparison to female (37.5%). Among them majority of patients (56.25%) were having high TG in which majority were female (37.50%) in compare to male (18.74%). Remaining 43.75% patients were low HDL in which majority were male (31, 25%). There was no statistically significant difference as p value is 0.315.
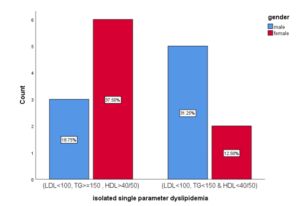
Figure 07: Isolated single parameter dyslipidemia in patients with type 2 DM on the basis of sex
Among total 54 type 2 DM patients, 16.66% patients were found to have mixed dyslipidemia in which male (88.88%) were affected more than female (44.82%).
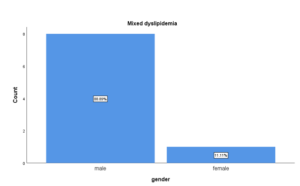
Figure 08: Mixed dyslipidemia in patients with type 2DM on the basis of sex
Among 29 (53.7%) patients who were having combined two parameter dyslipidemia, majority of patients (44.82%) were in age group of 45-59 yrs. followed by 31.03% patients in age group 30-44yr then followed by 24.13% patients in age group 60-75yr.This was no statistically significant difference as p value is 0.493. Among them 44.82% patients were having high LDL-C and high TG in which majority patients 24.14% were in age group of 45-59 yrs. Similarly, another 44.82% patients were having high TG and low HDL-C in which majority 20.69% were in age group of 30-44 yr. Remaining 10.3% patients had high LDL and low HDL in which majority 6, 90% were in age group of 45-59 yr.

Figure 09: Combined two parameter dyslipidemia on the basis of age
Among 16 patients who were having isolated single parameter dyslipidemia, majority 56.25% of patients were having high TG level in which majority of patients 31.25% were in age group of 45-59yr. Remaining 43.75% had low HDL and majority of them 31.25% fall under age group of 45-59 year.
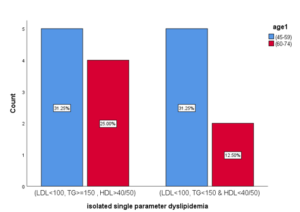
Figure 10: Isolated single parameter dyslipidemia on the basis of age
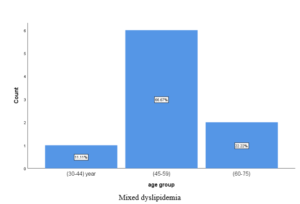
Figure 11: Mixed dyslipidemia on the basis of age
Among 54 type 2 DM patients, 46 were having poor glycemic control with HbA1C≥7 and 8 patients were having good glycemic control with HbA1C<7.
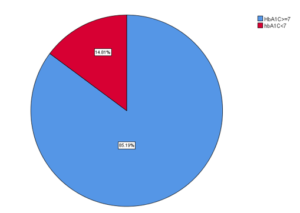
Figure 12: Prevalence of dyslipidemia in relation to glycemic status (HbA1C)
Among poor glycemic control patients, 36 (66.66%) were having high TG and 26 (48.15%) were having low HDL. Among good glycemic control patients, only 9.26% patients had high LDL 7.41% had high TG / high TC and only 5.56% had low HDL.
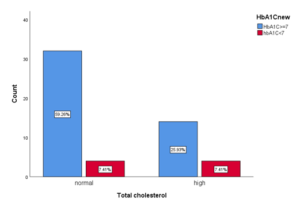
Figure 13: Total cholesterol level in relation with glycemic status
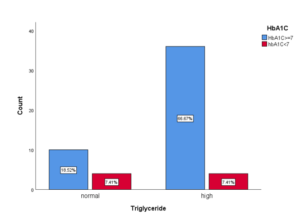
Figure 14: Total triglyceride level in relation with glycemic status
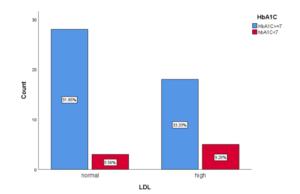
Figure 15: Total LDL level in relation with glycemic status
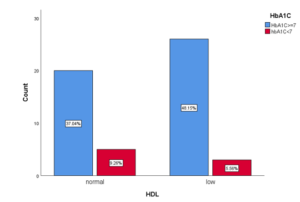
Figure 16: Total HDL level in relation with glycemic status
DISCUSSION
53.7% of them were in 45–59-year age group in which 31.48% are male and 22.22% are female. Mean age of study subjects is 53.87±12.15. In the study conducted in tertiary Care Centre in Nepal in the year of 2021 by [28] showed 34.1% patients belongs to 45–60-year age group in which 35.4% are male and 32.2% are female and mean age of Study subjects is 53.10±13.74. Studies done in KIST Medical College & Teaching Hospital, Ima dole, Lalitpur, Nepal by [34], in a tertiary teaching hospital of north east India by [19] show similar results. Similar study done by [35] in hospital-based study from Eastern Nepal showed higher prevalence of dyslipidemia in advance age with mean age of 54.15 ± 12.62 in type 2 DM patients. Our result is consistent with the western study conducted by [32] which showed mean age of study subjects is 57.07± 11.45. Our data is in concordance with these data. Males were more affected than females. In our study population 58.3% were males and 40.7% females. The M: F ratio was 1.4:1. Similar result was observed in study done by [28] in 2011, in which there were 58.9% males and 41.1% female. Study done in a tertiary center hospital of Nepal in 2017 by [24], Manipal teaching hospital Nepal by [37], Medical college Bhopal in India in 2015 by [22] show similar results. Similar result was observed in study done by [33] in referral hospital in North Eastern Ethiopia. Ethiopian in 2021, in which there were 50.3% males and 49.7% females. This finding was consistent with the study done by [32] in Nnewi South-East Nigeria in 2011. Similar finding was seen in the study conducted by [39]. Mean FPG, PPBG and HbA1C of male in study subjects were higher than that of female. In my study mean FPG, PPBS, HbA1C of male population in study group is 207.50±74.57, 314±102.27, 9.29±2.46 respectively and that of female population is 194.09±59.57, 271.56±71.01, 9.28±2.65 respectively. There were no statistically significant differences in mean of FPG, PPBG and HbA1C between male and female group. Similar results are found in study done by [19] in 2019. Which showed mean FBS, PPBS and HbA1C in male is 139.7 ± 43.2, 215.4 ± 57.2, 7.27 ± 1.2 respectively and that of female is 134.8 ± 36.4, 212.2 ± 63.0, 7.21 ± 1.0 respectively. The result is consistent with the study done by [29] showed higher mean FPG, PPBS, HbA1C in male (139.7 ± 43.2, 215.4 ± 57.2, 7.27 ± 1.2) than in female (134.8 ± 36.4, 212.2 ± 63.0, 7.21 ± 1.0). Whereas, study done by [37] in 2017 showed mean FBS in male was less than female. Mean FBS and HbA1C in male and female in that study was 134.2 ± 44.0, 6.4 ± 0.9, and 138.2 ± 40.6, 6.4 ± 0.9 respectively. Study conducted by [22] in rural health training center of medical college in Bhopal, Madhya Pradesh, India showed similar result in male subjects with higher mean FPG of 152.2±22.5 as compared to female (146.4±21.6) but in contrary to our study they found higher mean PPBG (252.3±25.4) in female as compared to male subjects. In our study, male group had higher mean LDL-C level (98.91±48.52) and low mean HDL-C (39.50±14.01) level whereas female group had higher mean TC (183.50±68.43) and TG (233.55±128,32) level. Study done by [40] had similar findings of high level of lipid abnormalities in female with mean values for total cholesterol (TC), triglyceride (TG), high density lipoprotein cholesterol (HDL-C), low density lipoprotein cholesterol (LDL-C) were 202.2 ± 5.9 mg/dl, 168.3 ± 8.2 mg/dl, 44.9 ± 1.3 mg/dl, 123.6 ± 5.2 mg/dl respectively as compared to male with mean values for TC, TG, HDL-C, LDL-C and VLDL-C were 182.5 ± 4.8 mg/dl, 128.1 ± 10.8 mg/dl, 40.8 ± 1.2 mg/dl, 105.4 ± 4.8 mg/dl and 36.2 ± 2.2 respectively. Hospital based study was Done in eastern Nepal by [35] showed more abnormalities in lipid profile in male group as compared to female i.e. mean TC (192.28 ± 55.47), TG (206.15 ±130.4), LDL (206.15 ± 46.94), HDL (43.96 ± 11.45) in male and TC (186.65 ± 39.61), TG (189.53 ± 107.86), LDL (107.66 ± 33.07), HDL (47.17 ± 13.47) in Female. Similar results were observed in study done by in medical college Bhopal India. Study done in Tertiary Care Centre of Nepal Sapkota LB [29] had found more lipid abnormalities in male (TC=214.1 ± 28.5, TG=188.9 ± 53.LDL=, 129.4 ± 27.7 as compared to female (TC=197.0 ± 19.7, TG=174.1 ± 31.9, LDL=116.6 ± 19.1). In our study the prevalence of dyslipidemia is more common in male population (59.26%) as compared to female population (40.74%). Age group of 45-59 yrs. had high prevalence of dyslipidemia (53.7%) in which male was affected more (31.40%) as compared to female (22.22%). Study done in tertiary care center in Nepal by [24] showed Prevalence of dyslipidemia in male was 85.71% and in female was 84.85%. Similarly Study done by [19] in tertiary teaching hospital in North east India showed high prevalence of dyslipidemia in age group of 36-50 years (52.77%) among them male were predominant (38.19%). Similar results were observed in the study conducted by [35] in which male patients (. 66%) showed higher prevalence of dyslipidemia as compared to female and prevalence of dyslipidemia is higher in advance age. This result is in concordance with the study done by [41]. Studies have depicted that glycation of proteins tends to be higher in the male patients compared to their female counterparts. The reason postulated for this could be due to the presence of some physiological state like pregnancy or metabolic conditions like obesity rather than sex specific genetic tendency. In our study the most common pattern of dyslipidemia observed was combined two parameter dyslipidemia (53.77%) in which male (51.72%) was mostly affected than female (44.82%). Most common combined two parameter dyslipidemia was (high LDL and high TG in frequency of 44.82% and (high TG and low HDL) in frequency of 44.82%. Remaining was high LDL and low HDL (10.34%). Among them 27.59% male subjects had high LDL and high TG whereas 24.14% female had high TG and low HDL. Isolated single parameter dyslipidemia was observed in 29.52% of study subjects in which male (62.50%) is affected more than female (37.5%). Among them 56.25% had high TG in which female (37.50%) was predominant than male (18.75%). Remaining 43.75% of them had low HDL in which male (31.25%) was predominant. In my study, I found 16.66% of study subjects had mixed dyslipidemia in which male (88.89%) was affected more than female (11.11%). This result is consistent with study done in Zaria Northwestern Nigeria by [20] showed high prevalence of combined two parameter dyslipidemia in which high LDL and high TG was seen in 41% of study subjects in which male was affected more (41.6%) and high TG and low HDL were seen more in female 3.1%. Most common isolated single parameter dyslipidemia was low HDL which was more prevalent in male population. Study done in Indian type 2 patients by [30] in 2010 showed Among the males with dyslipidemia the proportion of patients with mixed dyslipidemia, combined dyslipidemia and single parameter dyslipidemia were 14.1%, 44.9% and 41%, respectively. Figures for the same among female patients stood at 24.6%, 47.8% and 27.7%, respectively. Combined dyslipidemia with high LDL and low HDL was the most common pattern among males and females both, contributing to 22.7% and 33% patients of diabetic dyslipidemia, respectively. Second most common pattern among males was isolated high LDL, contributing to 21.3% of males with dyslipidemia. While among females isolated low HDL emerged as the second most common pattern affecting 13.4% dyslipidemia females. In contrary, study done by [22] in rural health training center of medical college in Bhopal, India showed among study subjects with dyslipidemia 38% had mixed dyslipidemia where LDL and triglycerides were increased and HDL was decreased. Male (57.8%) are more affected as compared to female (42.1%). 28% of study subject had isolated single parameter dyslipidemia in which male (64.28%) was affected more than female (35.71%) and most common isolated lipid abnormality observed was high LDL in both male and female. However, 20% had combined two parameter dyslipidemia in which male and female are equally affected and most common lipid abnormalities is high LDL and TG in male and high TG and low HDL in female. Similarly, study done by [37] in Nepalese individuals with type 2 diabetes which showed mixed dyslipidemia as the most prevalent (88.1%) and isolated dyslipidemia (10.1%) as the least prevalent forms. most prevalent form of single dyslipidemia was high LDL-C (73.8%) and combined dyslipidemia was high TG, high LDL-C and low HDL-C (44.7%). Males had significantly higher prevalence of high LDL-C, high non-HDL-C and mixed dyslipidemia than females. Study done in a tertiary center hospital of Nepal in 2017 showed among males with dyslipidemia, the proportion of patients with mixed dyslipidemia combined two parameter dyslipidemia and isolated single parameter dyslipidemia were 8.33%, 14.28%, 27.38% respectively while in female it was 19.70%, 24.24%, 30.30% respectively. Second most common pattern of dyslipidemia was combined two parameter dyslipidemia in which high LDL with high TAG was common in males (8.33%) and high TAG with low HDL was common in females (13.63%). The most common pattern of dyslipidemia among both males (14.28%) and females (25.76) was isolated dyslipidemia with low HDL. Study done in in a tertiary teaching hospital of north east India by [19] showed majority of type 2 DM patients had single parameter dyslipidemia (41.66%) followed by combined two parameter dyslipidemia (31.94%) and mixed dyslipidemia (16.66%). The most prevalent lipid abnormality in this study was hypertriglyceridemia in 66.66% (n= 96) followed by low HDL-C in 50% (n=72). Hypertriglyceridemia (47.2% & 19.4% of male & female respectively), high LDL-C (20.83% & 19.4% male & female respectively) was more common in male but low HDL-C was more common in female cases. (23.6% & 26.38% of male & female respectively). The most common pattern of combined dyslipidemia was low HDL-C levels (≤40 mg/dl in male &, 50 mg/dl in female) + elevated TG (≥150 mg/dl) in 16.66%. 16.66% of the adult population had mixed dyslipidemia: high TC + high TG + raised LDL-C (8.33%). Among 29 patients who were having combined two parameter dyslipidemia, majority of patients i.e., 44.82% were in age group of 45-59 yrs. in which majority of them (24.54%) had high LDL and TG. Among isolated single parameter dyslipidemia (29.62%), majority of patients were fall under 45–59-year age group and most common abnormalities is high TG which was seen in age group of 45-59 year. Among mixed dyslipidemia patient’s majority 66.67% were of age group of 45-59 years. This result is consistent with the study done by [37] in Nepalese individuals with type 2 diabetes and in rural health training center of medical college in Bhopal, India. Study done in in a tertiary teaching hospital of north east India by [19] showed combined two parameter dyslipidemia in which majority of them had high TG and low HDL. Among 54 type 2 DM patients, 46 were having poor glycemic control with HbA1C≥7 and 8 patients were having good glycemic control with HbA1C<7. Among poor glycemic control patients, most common lipid abnormalities observed was High TG (66.67%) followed by high HDL (48.15%). Among good glycemic control patients, high LDL and low HDL were major lipid abnormalities both in proportion of 9.26%. Study done in FUJAIRAH, UNITED ARAB EMIRATES by [23] showed 72% of them were poor glycemic control (HbA1c≥7%). Of these 56.9 %, 27.8 %, 18.1 % and 8.3 % had HDL-C, TG, LDL-C and TC out of target levels respectively Whereas, 28% of patients were good glycemic control and 50 %, 32.1%, 10.7 % and 7.1 % of them had HDL-C, TG, LDL-C, and TC out of target levels respectively. Significant correlation suggesting that poor glycemic control showed to be directly associated with hypercholesterolemia and elevated LDL-C level. An author [42] found that TC, LDL-C and TG were significantly positive correlated with FBS and HbA1C.
- CONCLUSIONS
High prevalence of dyslipidemia in type 2 DM patients was observed among male subjects and age group of 45-59 year. Most common lipid abnormality found was combined two parameter dyslipidemia in which male were affected more with most common pattern of dyslipidemia was high LDL and high TC and that was commonly seen in age group of 45-59 year. Most common isolated single parameter dyslipidemia observed in female was high TG and that observed in male was low HDL. Among poor glycemic control patient’s major lipid abnormality was high TG followed by low HDL. These lipid abnormalities might be the important in view of development of cardiovascular or cerebrovascular diseases. Hence type 2 diabetic patient should undergo the routine monitoring of blood sugar and lipid profile so that any abnormalities can be identified and preventive measures along with interventions can be initiated at the earliest.
REFERENCES
- Goldberg, I. J. (2021). Diabetic dyslipidemia: Causes and consequences. Journal of Clinical Endocrinology and Metabolism, 86(3), 965–971.
- O’Brien, T., Nguyen, T. T., & Zimmerman, B. R. (2022). Hyperlipidemia and diabetes mellitus. Mayo Clinic Proceedings, 73, 969–976.
- Muneshwor Sah, Ram Bahadur K.C, Prasanna Bahadur Amatya & Arati Kattel (2024). Association between Abo-Rh Blood Groups and Type-2 Diabetes Mellitus: Comparative Cross Sectional Study. Dinkum Journal of Medical Innovations, 3(08):619-629.
- Powers, A. C., Niswender, K. D., & Evans-Molina, C. (2018). Diabetes mellitus: Diagnosis, classification, and pathophysiology. In Harrison’s principles of internal medicine (20th ed., pp. 2850–2859). McGraw-Hill Education.
- Manila Shrestha, Kalpana Sharma, Srijana Ghimire, Swarnima Maskey, Prakash Pariyar & Chandra Bahadur Sunar (2024). Missed Nursing Care at Tertiary Hospital, Bharatpur, Chitwan. Dinkum Journal of Medical Innovations, 3(10):716-732.
- Cleeman, J. I., Grundy, S. M., Becker, D., & Clark, L. (2022). Expert panel on detection, evaluation, and treatment of high blood cholesterol in adults: Executive summary of the third report of the National Cholesterol Education Program (NCEP) Adult Treatment Panel (ATP III). JAMA, 285(19), 2486–2497.
- Type 2 diabetes as a coronary heart disease equivalent: An 18-year prospective population-based study in Finnish subjects. (2022). Diabetes Care.
- Mooradian, A. D. (2023). Cardiovascular disease in type 2 diabetes mellitus: Current management guidelines. Archives of Internal Medicine, 163(1), 33–40.
- Krauss, R. M. (2024). Lipids and lipoproteins in patients with type 2 diabetes. Diabetes Care, 27, 1496–1504.
- Riddle, M., Bakris, G., Blonde, L., Boulton, A., et al. (2022). American Diabetes Association: Standards of diabetic care. Diabetes Care, 43(1), 1–212.
- Reaven, G. M., Chen, Y. D., Jeppesen, J., Maheux, P., & Krauss, R. M. (2022). Insulin resistance and hyperinsulinemia in individuals with small, dense low-density lipoprotein particles. Diabetes.
- Parimal Koirala, Prasanna Bahadur Amatya, Lochan Karki, Milan Khadka & Binod Pantha (2024). Prevalence of Diabetes in Chronic Liver Disease Patients: A Cross-Sectional Study. Dinkum Journal of Medical Innovations, 3(10):690-699.
- Taskinen, M. R. (2023). Diabetic dyslipidaemia: From basic research to clinical practice. Diabetologia, 46, 733–749.
- Mooradian, A. D. (2019). Dyslipidemia in type 2 diabetes mellitus. Nature Clinical Practice Endocrinology & Metabolism, 5, 150–159.
- National Diabetes Register. (2019). Clinical usefulness of different lipid measures for prediction of coronary heart disease in type 2 diabetes. Diabetes Care, 34, 2095–2100.
- Betteridge, D. J. (2022). Lipid control in patients with diabetes mellitus. Diabetes Research and Clinical Practice.
- Prevalence of metabolic syndrome in Nepalese type 2 diabetic patients according to WHO, NCEP ATP III, IDF, and harmonized criteria. (2023). BMC Endocrine Disorders.
- Nepal Health Research Council (NHRC). (2020). Prevalence of non-communicable diseases in Nepal: Hospital-based study. NHRC.
- Ray Narayan, A., & Pandit, N. (2019). Clinical study on prevalence and pattern of dyslipidemia in type 2 diabetes mellitus patients in a tertiary teaching hospital of North East India. Journal of Evidence-Based Medicine and Healthcare, 6(29), 1978–1982.
- Bello-Ovosi, B. O., Ovosi, J. O., Ogunsina, M. A., Asuke, S., & Ibrahim, M. S. (2019). Prevalence and pattern of dyslipidemia in patients with type 2 diabetes mellitus in Zaria, Northwestern Nigeria. Pan African Medical Journal, 34, 123.
- Regmi, P., Gyawali, P., Shrestha, R., Sigdel, M., Mehta, D. K., & Majhi, S. (2024). Pattern of dyslipidemia in type 2 diabetic subjects in Eastern Nepal. Nepal Medical Journal.
- Goldberg, I. J. (2001). Diabetic dyslipidemia: Causes and consequences. Journal of Clinical Endocrinology and Metabolism, 86(3), 965–971.
- O’Brien, T., Nguyen, T. T., & Zimmerman, B. R. (2023). Hyperlipidemia and diabetes mellitus. Mayo Clinic Proceedings, 73, 969–976.
- Expert Panel on Detection, Evaluation, and Treatment of High Blood Cholesterol in Adults. (2021). Executive summary of the third report of the National Cholesterol Education Program (NCEP) expert panel on detection, evaluation, and treatment of high blood cholesterol in adults (Adult Treatment Panel III). JAMA, 285(19), 2486–2497.
- Powers, A. C., Niswender, K. D., & Evans-Molina, C. (2018). Diabetes mellitus: Diagnosis, classification, and pathophysiology. In Harrison’s principles of internal medicine (20th ed., pp. 2850–2859). McGraw-Hill Education.
- State of non-communicable diseases in Nepal. (2024). BMC Public Health, 14(1), 1–9.
- Cleeman, J. I., Grundy, S. M., Becker, D., & Clark, L. (2021). Expert panel on detection, evaluation, and treatment of high blood cholesterol in adults: Executive summary of the third report of the National Cholesterol Education Program (NCEP) Adult Treatment Panel (ATP III). JAMA, 285(19), 2486–2497.
- Type 2 diabetes as a coronary heart disease equivalent: An 18-year prospective population-based study in Finnish subjects. (2022). Diabetes Care.
- Mooradian, A. D. (2023). Cardiovascular disease in type 2 diabetes mellitus: Current management guidelines. Archives of Internal Medicine, 163(1), 33–40.
- Krauss, R. M. (2024). Lipids and lipoproteins in patients with type 2 diabetes. Diabetes Care, 27, 1496–1504.
- Riddle, M., Bakris, G., Blonde, L., Boulton, A., et al. (2020). American Diabetes Association: Standards of diabetic care. Diabetes Care, 43(1), 1–212.
- Reaven, G. M., Chen, Y. D., Jeppesen, J., Maheux, P., & Krauss, R. M. (2022). Insulin resistance and hyperinsulinemia in individuals with small, dense low-density lipoprotein particles. Diabetes.
- Effects of insulin resistance and type 2 diabetes on lipoprotein subclass particle size and concentration determined by nuclear magnetic resonance. (2023). Diabetes.
- Taskinen, M. R. (2023). Diabetic dyslipidaemia: From basic research to clinical practice. Diabetologia, 46, 733–749.
- Mooradian, A. D. (2018). Dyslipidemia in type 2 diabetes mellitus. Nature Clinical Practice Endocrinology & Metabolism, 5, 150–159.
- National Diabetes Register. (2021). Clinical usefulness of different lipid measures for prediction of coronary heart disease in type 2 diabetes. Diabetes Care, 34, 2095–2100.
- Betteridge, D. J. (2022). Lipid control in patients with diabetes mellitus. Diabetes Research and Clinical Practice.
- Prevalence of metabolic syndrome in Nepalese type 2 diabetic patients according to WHO, NCEP ATP III, IDF, and harmonized criteria. (2023). BMC Endocrine Disorders.
- Nepal Health Research Council (NHRC). (2020). Prevalence of non-communicable diseases in Nepal: Hospital-based study. NHRC.
- Ray Narayan, A., & Pandit, N. (2019). Clinical study on prevalence and pattern of dyslipidemia in type 2 diabetes mellitus patients in a tertiary teaching hospital of North East India. Journal of Evidence-Based Medicine and Healthcare, 6(29), 1978–1982.
- Bello-Ovosi, B. O., Ovosi, J. O., Ogunsina, M. A., Asuke, S., & Ibrahim, M. S. (2019). Prevalence and pattern of dyslipidemia in patients with type 2 diabetes mellitus in Zaria, Northwestern Nigeria. Pan African Medical Journal, 34, 123.
- Regmi, P., Gyawali, P., Shrestha, R., Sigdel, M., Mehta, D. K., & Majhi, S. (2024). Pattern of dyslipidemia in type 2 diabetic subjects in Eastern Nepal. Nepal Medical Journal.
Publication History
Submitted: July 23, 2025
Accepted: August 11, 2025
Published: September 30, 2025
Identification
D-0492
DOI
https://doi.org/10.71017/djmi.4.9.d-0492
Citation
Sarjan Shrestha & Amrita shrestha (2025). Dyslipidemia in Patients with Type 2 Diabetes Mellitus Attending Bir Hospital, NAMS, Nepal. Journal of Medical Innovations, 4(09):587-603.
Copyright
© 2025 The Author(s).