Vol. 5 No.01 (2026) | Page: 31-49 | Original Article 
Mother Tongue as Medium of Instruction for Equitable Access to Education
Nabina Bajracharya 1*
-
- Faculty Of Humanities and Social Sciences, Mid-West University, Birendranagar, Nepal.
 nabinabajra@gmail.com




ABSTRACT
Background: Nepal promotes Mother Tongue-Based Multilingual Education (MTB-MLE) and guarantees children the right to education in their mother tongue. However, most schools use Nepali as the medium of instruction, creating challenges for students from diverse linguistic backgrounds.
Objective: To assess the effect of home language use on the reading achievement of Grade 3 students in community schools of Lalitpur Metropolitan City, Nepal.
Methods: Reading achievement was measured using Oral Reading Fluency (ORF) and Reading Comprehension tests from the Early Grade Reading Assessment (EGRA). Students were grouped according to the mother tongue spoken by parents and children.
Results: Findings showed a decline in mother tongue use across generations, as many parents encouraged children to speak Nepali. Students who spoke only Nepali generally achieved higher ORF and comprehension scores than those who spoke only a non-Nepali mother tongue.
Conclusion: Early reading achievement is strongly influenced by the relationship between home language and the language of instruction. The findings support the need for effective implementation of MTB-MLE to reduce language barriers, improve literacy outcomes, and enhance educational quality and equity in Nepal.
Keywords: mother tongue-based multilingual education (MTB-MLE), oral reading fluency; reading comprehension, Nepal
Key points:
- Does home language use influence reading fluency and comprehension among Grade 3 students in Nepalese community schools?
- Students speaking only Nepali generally achieve higher reading fluency and comprehension than those speaking only non-Nepali mother tongues.
- Implementing mother tongue-based multilingual education may reduce language barriers and promote equitable early literacy development.
- INTRODUCTION
Language is a mean of communication through which we exchange our views, ideas, thoughts and emotions or perspectives. It is a symbol that we acquire through listening, reading and writing that makes mental conversation leading to develop a meaning or mental thought [1]. The first language a child gets familiar with is a language that speaks in his/her house. She/he starts to struggle to learn to communicate in it [2]. But when a child goes to a school and taught in a language different than s/he speaks at home, then again there starts another struggle to understand that language [2,3]. For the children for whom the language s/he use at home and in school is same, would be easier to adapt the learning environment in school classrooms but for the one whom it is new language, would struggle to learn to understand that language rather than learn to read in that language [4]. Children who do not learn to read in early grades are less likely to perform well in higher grade, limiting their future economic and development opportunities [5]. Nepal a country having 125 caste and ethnic communities and 123 languages and dialects [6], but the medium of the teaching in 80-85% public school is only Nepali across the country. Government has achieved a much more in education section in terms of enrollment rate. In 2015, net enrolment rate in primary education for Nepal was 96.9 %. It is increased from 66.6 % in 1988 to 96.9 % in 2015 growing at an average annual rate of 4.51 %. But, looking to a National Assessment of Student Achievement report, 2018, percentage of the student acquiring their grade level proficiency in Nepali subject of Grade 3 has decreased from 63% of student acquiring the grade level [3,7]. This shows, Education quality of the Nepal is declining. There could be the different factors which affect the education quality. Medium of Instruction could be one among them. For instance, same report also mentioned that in grade 5, there is remarkably higher significant difference in the achievement of the Nepali speaking student than that of the student who does not speak Nepali at home [1,2,8]. In Nepal there are more than 40000 schools across the country. But the text books are just on Nepali language [6,9]. In the homogenous community where people do not understand the Nepali language are forced to use the Nepali language books as they do not have any choice. In 2014/2015 flash report government has claimed that they has been using 62 languages as a Medium of Instruction in 5587 schools throughout the country in early grades [10]. But, the learning outcomes of these children are not safeguarded. Likewise, language knowledge of the teacher appointed for the respective schools is also not guaranteed [11]. It is easier for children to adapt in learning environment in school classrooms when the teachers can use their languages [8,12]. The use of mother tongue language as the medium of instruction in the classroom teaching-learning activities promotes meaningful learning. Because of its indispensable nature of significance in the classroom learning, the use of mother tongue/first language as medium of instruction is increasing mostly in the schools of third world multilingual countries like Nepal [13]. Therefore, language used by the teachers to convey the information to the early grade students is crucial as it directly affects the children’s learning. Nepal has remarkable achievement in education in terms of net enrollment rate, 96.9% which has been gradually increased 4.51% annually since 1988. But, the National Early Grade Reading Assessment carried out by the government shows that the children are not even being able to meet their grade level achievement [15]. The children tested for the oral reading Fluency, scores average of 12.7 and 23.3 correct word per minute (CWPM) after one year and two year of school completion which must be 25 CWPM and 35 CWPM respectively for the respective grade as of Nepal government bench mark. This result could not guarantee the reading level of the student who speaks different language other than Nepali at their home [11,14]. According to the Mathew’s Effect; “Early success in acquiring reading skills usually leads to later successes in reading as the learner grows, while failing to learn to read before the third or fourth year of schooling may be indicative of life-long problems in learning new skills” [17]. Sustainable Development Goal 4’s target 4.1, which states that “By 2030, ensure that all girls and boys complete free, equitable and quality primary and secondary education leading to relevant and effective learning outcomes” [9,18]. Aligning with SGD, Nepal government has made mandatory free basic education but struggling to provide a quality education to its all children. Among the many factors language is also one to be considered to ensure the quality education as many children do not understand Nepali language which is a medium of instruction in more than 80% of schools in Nepal. As a result early grade students are not being able to achieve their grade level reading achievement. To assess the oral reading fluency of grade 3 students and compare the differences of their reading level and comprehension score, according to their first language they speak.
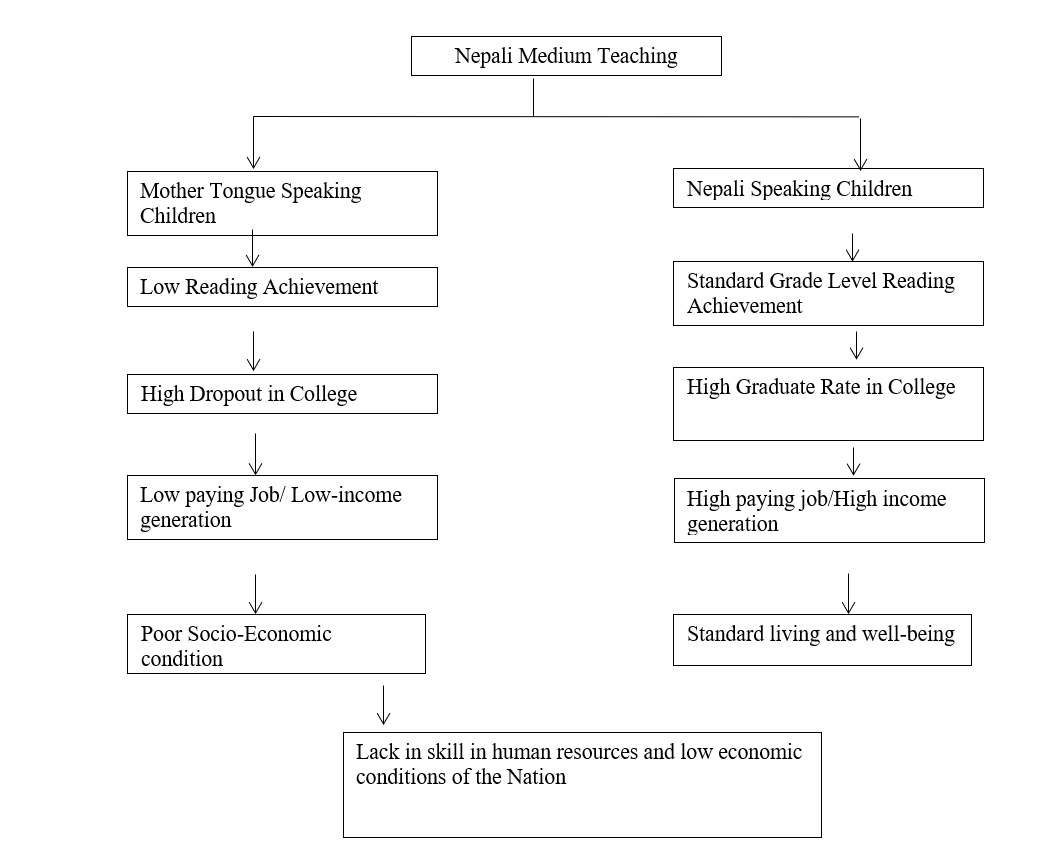 Figure 01: Assess the oral reading fluency and compare the differences of their reading level and comprehension score, according to their first language they speak.
- MATERIALS AND METHODS
The type of research used is quantitative where the major objective is to test the oral reading fluency of the Mother-Tongue speaking children and Nepali language speaking children of Lalitpur Metropolitancity. The chapter contains detailed information on the method of data collection, measurement and analysis. Community Schools of Lalitpur Metropolitan has both type of student. Type one, who speak mother tongue and type two; who use Nepali as their first language. Therefore, the nine schools among the 40 schools were selected to represent the whole population of the metropolitan city’s community school student reading achievement.
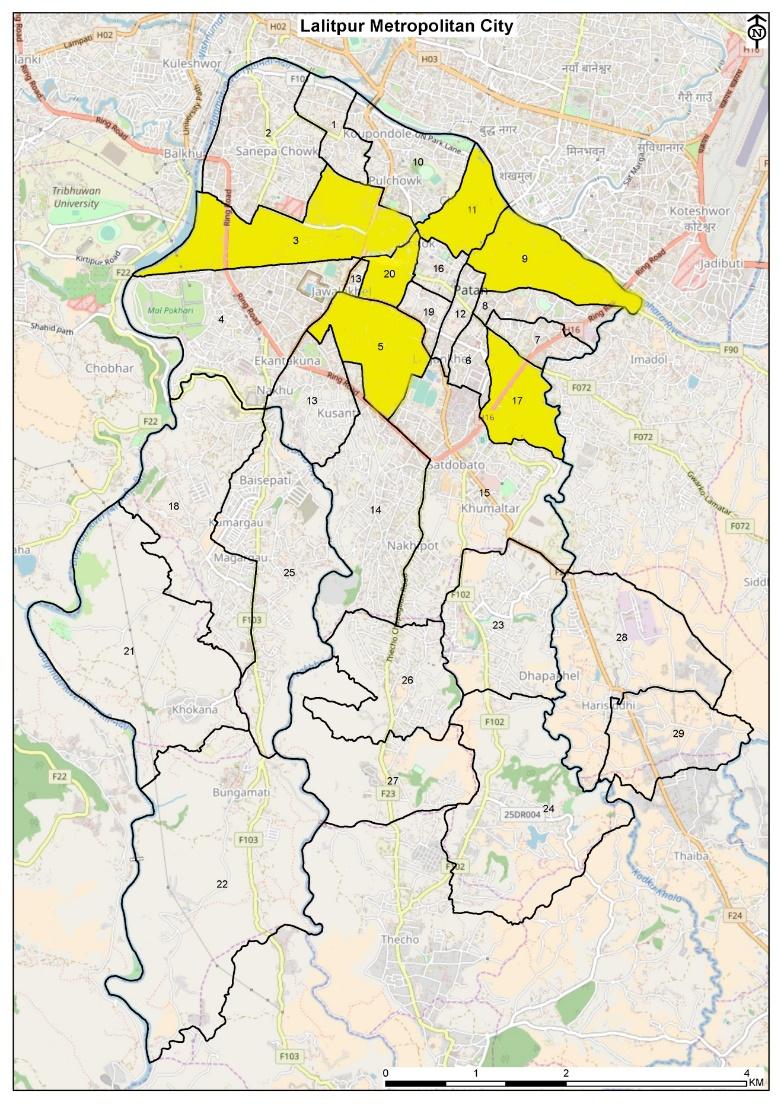
Figure 02: Study area of research highlighted in Lalitpur Metropolitan city map
The universe of the study is a finite number of the student studying in the community schools of the Lalitpur Metropolitan City. As per Educational Management Information system (EMIS) data of 2075 BS academic session, there is altogether 1048 student studying grade 3 in community schools of Lalitpur Metropolitan City. 218 students from different nine community schools were selected for the study. The study utilized cluster sampling through non-probability method. For the population size of 1000, the sample size should be 286 to maintain the 5% precision level where confidence level is 95% and p value is 0.5. At the beginning 300 number student is recorded for the study, but while visiting the school it is found that, in most of the school, the number of drop out is about 10 to 20% of its total number of students. Which means if the average percentage of the dropout is taken then it will be 15%, then,15% of 1048 student would be 157 and student number would drop to 891 and for the population size of 891 using the same formula the sample size come around 240. Therefore, the collected data number of 218 is then further carried out for the analysis. The early grade assessment (EGRA) is one tool used to measure students’ progress toward learning to read. It is a test that is administered orally, one student at a time. In about 15 minutes, it examines a student’s ability to perform fundamental pre-reading and reading skills. The thesis used primary method of data collection. Personal interview and test were carried out by conducting research at respective schools, grade 3 students. Students were called one by one in the separate room and were interviewed and tested for the reading fluency and comprehension test. All the data were collected electronically using kobo tool box (data collection app). The offline data were later synced and appended at once. After the completion of the field study data were compiled from different android devices used during the data collection. Data were compiled in excel and were cleaned and coded to numeric, to conduct the further analysis, Statistical Package for the Social Sciences (SPSS) was used to carry out different statistically significant test of the study. Analysis is specially driven by the theory that learning to read in one’s ‘mother tongue’ or first language enhances a child’s achievement relative to that of children obliged to learn to read in second language.
- RESULTS & DISCUSSION
This section deals with the result of the reading achievement of children belonging to the different language group along with their score in comprehension. It further provides the analysis and interpretation in the difference in the reading and comprehension achievement of the different language group children. Altogether 218 students of Grade three were assessed during the study in the selected 9 schools of the Lalitpur Metropolitan city. Among 218 students, 116 (53%) is of boys and 102 (47%) is of Girls. The percentage of the boys seems higher than the girls in the study area. The detail of the student assessed is presented in table 01.
Table 01: Number of students assessed in school by sex
| S.N. | School Name | Sex | Total | |
| Boys | Girls | |||
| 1 | Bal Binod Basic School | 2 | 5 | 7 |
| 2 | Lalit Kalyan Basic School | 4 | 4 | 8 |
| 3 | Madan Smarak Secondary School | 4 | 6 | 10 |
| 4 | Namuna Machindra Secondary School | 5 | 12 | 17 |
| 5 | Prabhat Secondary School | 20 | 26 | 46 |
| 6 | Shree Chandi | 8 | 6 | 14 |
| 7 | Shree Shanti Basic School | 8 | 11 | 19 |
| 8 | Shree Shramik Shanti Secondary School | 17 | 16 | 33 |
| 9 | Tri Padma Secondary School | 34 | 30 | 64 |
| Total | 102 (47%) | 116 (53%) | 218 | |
About 76% of the tested students were lies in 9-10 age groups. The lower age is age 7 and the highest age is 14. There is only 1 student of age 14 in this study. The detail of the students’ age is given in table 2.
Table 02: Age of assessed student
| Age | Female | Male | Total | Percentage |
| 7 | 1 | 1 | 2 | 0.92 |
| 8 | 8 | 11 | 19 | 8.72 |
| 9 | 33 | 29 | 62 | 28.44 |
| 10 | 32 | 29 | 61 | 27.98 |
| 11 | 19 | 24 | 43 | 19.72 |
| 12 | 4 | 17 | 21 | 9.63 |
| 13 | 4 | 5 | 9 | 4.13 |
| 14 | 1 | 1 | 0.46 | |
| Total | 102 | 116 | 218 | 100.00 |
Nepal being a multi caste and ethnic country, it is also important to look on to population diversity. Well, in this study there is highest 57% of Janajati, followed by Brahmin, Chhetri, Madhesi, Others and Dalit; in percentage; 11%, 9%9%, 8% and 6%, respectively. It is shown in table 3.
Table 03: Caste/Ethnicity breakdown of all students
| Ethnicity | Girls | Boys | Total | Percentage |
| Brahmin | 10 | 13 | 23 | 11 |
| Chhetri | 13 | 6 | 19 | 9 |
| Dalit | 6 | 8 | 14 | 6 |
| Janajati | 62 | 63 | 125 | 57 |
| Madhesi | 5 | 15 | 20 | 9 |
| Others | 6 | 11 | 17 | 8 |
| Total | 102 | 116 | 218 | 100 |
Looking into a father’s occupation of the studied child, 47.71% of the student belongs to the wage labor group, 15.14% of students are from service holder father and 18.35% student’s father is in business. The business means a small business like; Small Street shops, small street food shop (Chana-chatpate, panipuri, etc). Similarly, looking into a mother occupation, high percentage of the wife are housewife (29.82%), 26.61% mothers are in wage labor and 19.72% of parents are in service. Here service means a fewer paying jobs, like; maid, cleaner, officer supporter, etc. The detail of the father’s and mother’s occupation is shown in table 4.
Table 04: Parent’s Occupation
| Occupation | Father’s Occupation | Mother’s Occupation | ||
| Parents No. | Percentage | Parents No. | Percentage | |
| Agriculture | 2 | 0.92 | 2 | 0.92 |
| Business | 40 | 18.35 | 30 | 13.76 |
| Foreign Employment | 18 | 8.26 | 8 | 3.67 |
| Service | 33 | 15.14 | 43 | 19.72 |
| Wage labor | 104 | 47.71 | 58 | 26.61 |
| Housewife | – | – | 65 | 29.82 |
| Others | 21 | 9.63 | 12 | 5.50 |
| Grand Total | 218 | 100 | 218 | 100 |
To understand the economic condition of the student’s family, the information on their house and land availability, is collected. Well 86.70% of the students are staying in a rented house. 12.39% have their small house. Similarly, 94.04% of them said they have their own house and land in their village and 5.96% responded on not having any land. This shows that the students are mostly migrated from the rural areas of Nepal and some also from India for the better living opportunity to Lalitpur-Metropolitan city. The status of the student’s living house and land owe by their family is presented in the table 5 and 6.
Table 05: House type of the tested students
| House Type | Student No. | Percentage |
| Own | 27 | 12.39 |
| Rented | 189 | 86.70 |
| Others | 2 | 0.92 |
| Grand Total | 218 | 100 |
Table 06: Land owe by the student’s family
| Owe Land | School No. | Percentage |
| Do not owe Land | 13 | 5.96 |
| Have Own land | 205 | 94.04 |
| Grand Total | 218 | 100 |
Parental involvement is crucial in fostering a positive view of learning. These interactions include engagement, meaningful conversations, and appropriate parental guidance or scaffolding. Parents should engage in communication with their child’s teacher and school. This includes checking take home folders daily and responding to its contents. Parents also should be engaged and take an interest in what their child is learning. Assisting children with their with homework is an effective way for them to become aware of what their child is learning in the classroom and what he or she finds difficult, easy, distasteful, or enjoyable [11,18]. 72.94% of student’s father is literate and 54.59% mothers seem literate. Here literate means a person able to read a newspaper. Less than 2% parents hold a higher education. This indicates that tested student’s parents do not have higher education at all. Table 8 shows the education status of the tested student.
Table 07: Education status of the parents
| Education | Father’s Education | Mother’s Education | ||
| No. | Percentage | No. | Percentage | |
| Bachelors | 1 | 0.46 | 1 | 0.46 |
| Illiterate | 55 | 25.23 | 94 | 43.12 |
| Intermediate | 3 | 1.38 | 4 | 1.83 |
| Literate | 159 | 72.94 | 119 | 54.59 |
| Grand Total | 218 | 100 | 218 | 100 |
Most of the child’s mother tongue is determined by their father’s and mother’s mother tongue. Grouping of the tested children is done in two ways. First grouping is done by the first language (L1) use by the children for speaking. In the studied school three major group of language speaking student are found. They are; Nepal Bhasa, Nepali and Tamang with 61%, 19% and 5% respectively. Beside these languages, there is very few numbers of the student who speaks different language, such as, Maithali, Hindi, Gurung, Bhojpuri, etc. These language group students were categories into the ‘Others’ group. The detail of student is presented in Table 10.
Table 08: Breakdown by MT (L1) of child
| Language | Female | Male | Grand Total | Percentage |
| Nepal Bhasa | 5 | 6 | 11 | 5 |
| Nepali | 63 | 71 | 134 | 61 |
| Tamang | 19 | 23 | 42 | 19 |
| Others | 15 | 16 | 31 | 14 |
| Grand Total | 102 | 116 | 218 | 100 |
The second grouping of the children is done by combining the language use by their parents or says the first language of their parents. Child learns their first language from their parents. Therefore, the language knowledge of the parents highly influences the learning of their children. It is also said that the one who has the better knowledge in a language can only teach language to other. In this study group children are categories’ into major four different groups according to the language they communicate with their parents or in their house. They are; 1. Parents and child using same language as mother tongue, 2. Parents and child using Nepali as mother tongue, 3. Parents having different mother tongue and child speak one of them or Nepali as mother tongue. 4. Parents using same mother tongue but child speak only Nepali. These four categories are further expanded to see the difference with in the same category. The grouping of the combining the parent and child MT in presented in Table 9.
Table 09: Grouping of tested child by language they use at their home
| Classification | Group Named | Sub Group* | Sample | Percentage |
| Parents and child using the same language as MT | Only MT | a. Only Tamang (36)
b. Only Nepal Bhasa (7) c. Only Others (31) |
74 | 33.94 |
| Parents and child using Nepali as MT | Only Nepali | – | 80 | 36.70 |
| Parents having different MT and child use one of them or Nepali as MT | Mixed | a. Mixed MT (10)
b. Mixed Nepali (12) |
22 | 10.09 |
| Parents using same MT but child speak only Nepali | MT Nepali | – | 42 | 19.27 |
| Total | 218 | 100 | ||
*The number of the sample in the respective group is presented in the bracket.
Children belonging to the mother tongue speaking parents other than Nepali are shifting their MT to Nepali language. Looking in the data of the MT of the parents and child, MT of the parents were not completely transferred to their child. The trend of teaching Nepali as child’s first language is high in all MT speaking parents. 20% of Tamang child, 45% of Newar child and 49% of other caste child cannot speak their parents MT but they are taught to speak Nepali first as their MT. This may lead to language Genocide in future. This might be a threat for the extinction of our culture, tradition, art, festivals, etc. Sieradzka, (2016) gave a six reason because of which child leave their MT. They are; 1. Two parents having two different MT, 2. Exposure to language, 3. Lack of consistency, 4. Lack of Need for the Language, 5. Language skill of a parents and 6. Lack of pride to MT. The detail of the MT of parents and child is presented in table and chart
Table 10: Detail of the parents and child MT
| Language | Father’s L1 | Mother’s L1 | Child’s L1 | |||
| No. | Percentage | No. | Percentage | No. | Percentage | |
| Tamang | 53 | 24.31 | 58 | 26.61 | 42 | 19.27 |
| Nepal Bhasa | 20 | 9.17 | 18 | 8.26 | 11 | 5.05 |
| Nepali | 84 | 38.53 | 90 | 41.28 | 134 | 61.47 |
| Others | 61 | 27.98 | 52 | 23.85 | 31 | 14.22 |
| Grand Total | 218 | 100.00 | 218 | 100 | 218 | 100 |
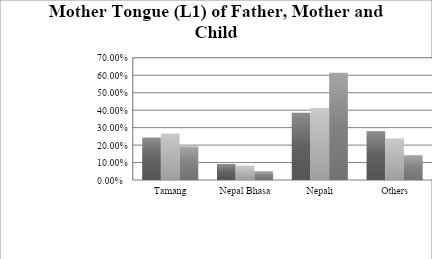
Figure 03: Detail of parent’s and child’s MT
Oral Reading Fluency test is a main part of the research. At first student are made comfortable with the enumerator by asking some of their likes and dislikes. Once they say they are ready, a short story of one paragraph was given to the student and made them to read. As they started to read, stop was started and as they stop to read it was stopped. Correct words read in the minute was then counted and recorded. As the Staden (2016), provide clear evidence that African children stand to be disadvantaged the most when a strong mother tongue base has not been developed in the early years and when education for these children is only available through a medium of instruction other than the mother tongue, this study also shows ‘Only MT’ speaking children has lowest CWPM than other language speaking group. Looking into the CWPM by the MT of the child, Nepali speaking children has a high average CWPM which is 37.90. Similarly, Tamang speaking children has second highest, 35.93, then children who speak other language has 27.06 CWPM and Nepal Bhasa speaking children have lowest average CWPM of 25.73 as shown in figure. As it is already discussed in previous section about the grouping of the children, the CWPM is also checked by second type of grouping. In which surprisingly, the child of the different MT speaker parents who speak one of their MT has highest average CWPM of 42.20. But again, combining it with Nepali speaking group whose parents speak different MT is drops down to 36.09. The second highest is Only Nepali speaking group having average CWPM 40.49. Only MT speaking group has a lowest CWPM of 29.85, but only Tamang speaking children has highest in Only MT speaking category i.e. 34.56. The detail of the result is presented in figure.
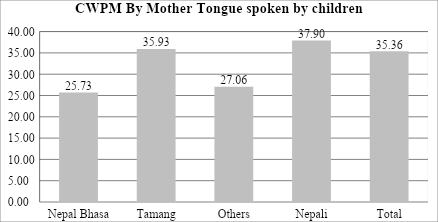
Figure 04: CWPM of MT of child
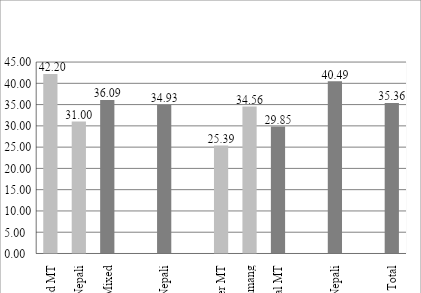
Figure 05: CWPM by parent’s and child’s MT grouping
Nepal government has set a benchmark for the ORF test. For grade 3 a child has to read 45 correct words per minutes and should have 80% correct answers in comprehension. Here, as per their CWPM score, data is categories into ‘At’ ‘Below’ and ‘Above’ where ‘At’ means child having exact 45 CWPM as the benchmark set by the Nepal government. ‘Below’ means child having less than 45 CWPM and ‘Above’ means having greater than 45 CWPM. Result shows that, ‘Only Nepali’ speaking group has highest percentage of student in ‘Above’ category and ‘Mixed MT’ group has second highest percentage of student. But while combining ‘At’ and ‘Above’ category ‘Mixed MT’ group gets a highest percentage, 60% of the children meeting a grade level target of 45 CWPM. Likewise, ‘Only MT’ speaking group has lowest percentage of children reaching to grade level Target. Detail result of each categorized group is present in figure.
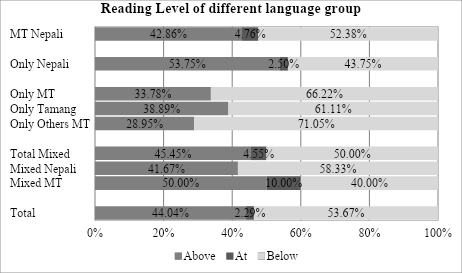
Figure 06: Reading level of different language group
After the ORF Test student were asked six questions related to that same paragraph for the comprehension test. Out of these six questions, student has to correctly answer at least five questions to meet a grade level bench mark for the comprehension task. In this test also, ‘Mixed’ group has highest 31 percentages of children securing 80% of the comprehension and ‘Only Nepali’ group has 27.5% of student achieved grade level comprehension target. As, previous result, ‘Only MT’ group has lowest percentage, about 16% of children, achieving grade level comprehension target. About 26% of ‘MT Nepali’ group student met the target. The detail result is presented in table 13. This result support the literature of Grabes (2012) who states that by starting with the language that young learners speak at home, the gap in understanding can be bridged better and easier. Hence, elementary students can better absorb lessons.
Table 11: Result of Comprehension Test
| Comprehension score | Mixed | MT_Nepali | Only MT | Only Nepali | Total | |||||
| No. | Percentage | No. | Percentage | No. | Percentage | No. | Percentage | No. | Percentage | |
| 0 | 5 | 22.73 | 6 | 14.29 | 14 | 18.92 | 8 | 10 | 33 | 15.14 |
| 1 | 1 | 4.55 | 1 | 2.38 | 4 | 5.41 | 1 | 1.25 | 7 | 3.21 |
| 2 | 0.00 | 8 | 19.05 | 8 | 10.81 | 10 | 12.50 | 26 | 11.93 | |
| 3 | 4 | 18.18 | 11 | 26.19 | 21 | 28.38 | 18 | 22.50 | 54 | 24.77 |
| 4 | 5 | 22.73 | 5 | 11.90 | 16 | 21.62 | 21 | 26.25 | 47 | 21.56 |
| 5 | 3 | 13.64 | 9 | 21.43 | 8 | 10.81 | 11 | 13.75 | 31 | 14.22 |
| 6 | 4 | 18.18 | 2 | 4.76 | 3 | 4.05 | 11 | 13.75 | 20 | 9.17 |
| Grand Total | 22 | 100 | 42 | 100 | 74 | 100 | 80 | 100 | 218 | 100 |
Similarly, average comprehension test score is also compared. In which ‘Only Nepali’ group has highest scores of 3.50 and ‘Mixed has slightly lesser score of 3.27. But again, sub-category of ‘Mixed’ group’s, ‘Mixed MT’ has the highest among all average comprehension score which is 4.10 higher than of ‘Only Nepali’. ‘MT Nepali’ continued the same legacy as previous result having average 3.02 comprehension score. And again the “Only MT’ stood at a bottom of all other language group with an average score 2.77. Detail result on the average comprehension score is presented in figure.
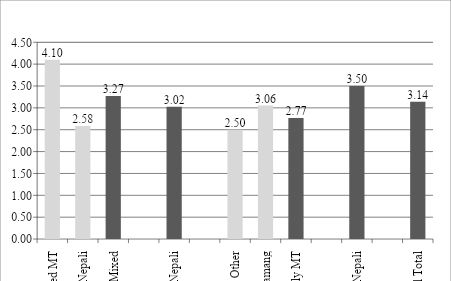
Figure 07: Average of Total comprehension score by language group
Study is carried out for the student of grade 3 at the end of their academic year, which means the tested students has already completed the 3 years of schooling. In this three year if the student could not read a single word means student is not learning well in the school or s/he is having problem with learning. Well this is other part of study. Here, zero scorers are observed with the lens of language perspective only. Zero scorer result shows, ‘Only MT’ group has high percentage of the student, 16.22%, among four major groups and within ‘Only MT’; ‘Only Other MT’ group student has highest percentage of student which is 26.32%, who cannot read a single word. These result shows, MT speaking student were falling behind in Nepali reading compare to other language group.
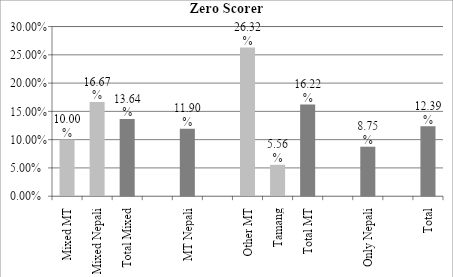
Figure 08: Result of Zero Scorer by language Group
Comprehension and CWPM, both are combined to determine the grade level reading level. Nepal government has set the target of 45 CWPM and 80% comprehension for the grade 3. Comprehension score were aligned with a CWPM acquired by the student to achieve respective comprehension scores are kept along and see the relationship between comprehension score and CWPM. In ‘Mixed’ group 18.18% of the student achieved a 100% of comprehension score with 53 CWPM, ‘MT Nepali’s 4.76% students have 100% comprehension score with 48.50 CWPM, ‘Only MT’ had 4.05% student having 39 CWPM and ‘Only Nepali’ has 13.75% of student with 56.55 CWPM. This shows that child, somehow linked with MT read slowly to get a full comprehension whereas child familiar with only Nepali has nearly full CWPM to have a full comprehension. Detail result is presented in table 13.
Table 12: CWPM acquired by child to get respective comprehension score
| Comprehension score | 0 | 1 | 2 | 3 | 4 | 5 | 6 | Grand Total | |
| Mixed | No | 5 | 1 | 4 | 5 | 3 | 4 | 22 | |
| Percentage | 22.73 | 4.55 | 0.00 | 18.18 | 22.73 | 13.64 | 18.18 | 100.00 | |
| CWPM | 0.20 | 22.00 | 40.25 | 50.40 | 48.67 | 53.00 | 36.09 | ||
| MT_Nepali | No | 6 | 1 | 8 | 11 | 5 | 9 | 2 | 42 |
| Percentage | 14.29 | 2.38 | 19.05 | 26.19 | 11.90 | 21.43 | 4.76 | 100 | |
| CWPM | 0.17 | 4.00 | 21.38 | 42.91 | 53.20 | 50.67 | 48.50 | 34.93 | |
| Only MT | No | 14 | 4 | 8 | 21 | 16 | 8 | 3 | 74 |
| Percentage | 18.92 | 5.41 | 10.81 | 28.38 | 21.62 | 10.81 | 4.05 | 100.00 | |
| CWPM | 0.79 | 12.50 | 19.88 | 33.52 | 48.06 | 49.88 | 39.00 | 29.85 | |
| Only Nepali | No | 8 | 1 | 10 | 18 | 21 | 11 | 11 | 80 |
| Percentage | 10 | 1.25 | 12.50 | 22.50 | 26.25 | 13.75 | 13.75 | 100 | |
| CWPM | 0.63 | 55.00 | 22.50 | 38.56 | 49.43 | 54.55 | 56.55 | 40.49 | |
| Total | No | 33 | 7 | 26 | 54 | 47 | 31 | 20 | 218 |
| Percent | 15.14 | 3.21 | 11.93 | 24.77 | 21.56 | 14.22 | 9.17 | 100 | |
| Grand Total | 0.55 | 18.71 | 21.35 | 37.61 | 49.47 | 51.65 | 52.40 | 35.36 | |
To have a clear concept on the relationship between Comprehension and CWPM, CWPM is plotted in x-axis and comprehension is plotted in a y-axis in box plot chart in figures 12, 13, 14 and 15. Looking into a boxplot chart it can be observed that an ‘Only MT’ has lowest average CWPM with a greater variation in CWPM score who scored 6 out of 6 correct comprehension answers in comprehension test. This means ‘Only MT’ is slow in Nepali reading.
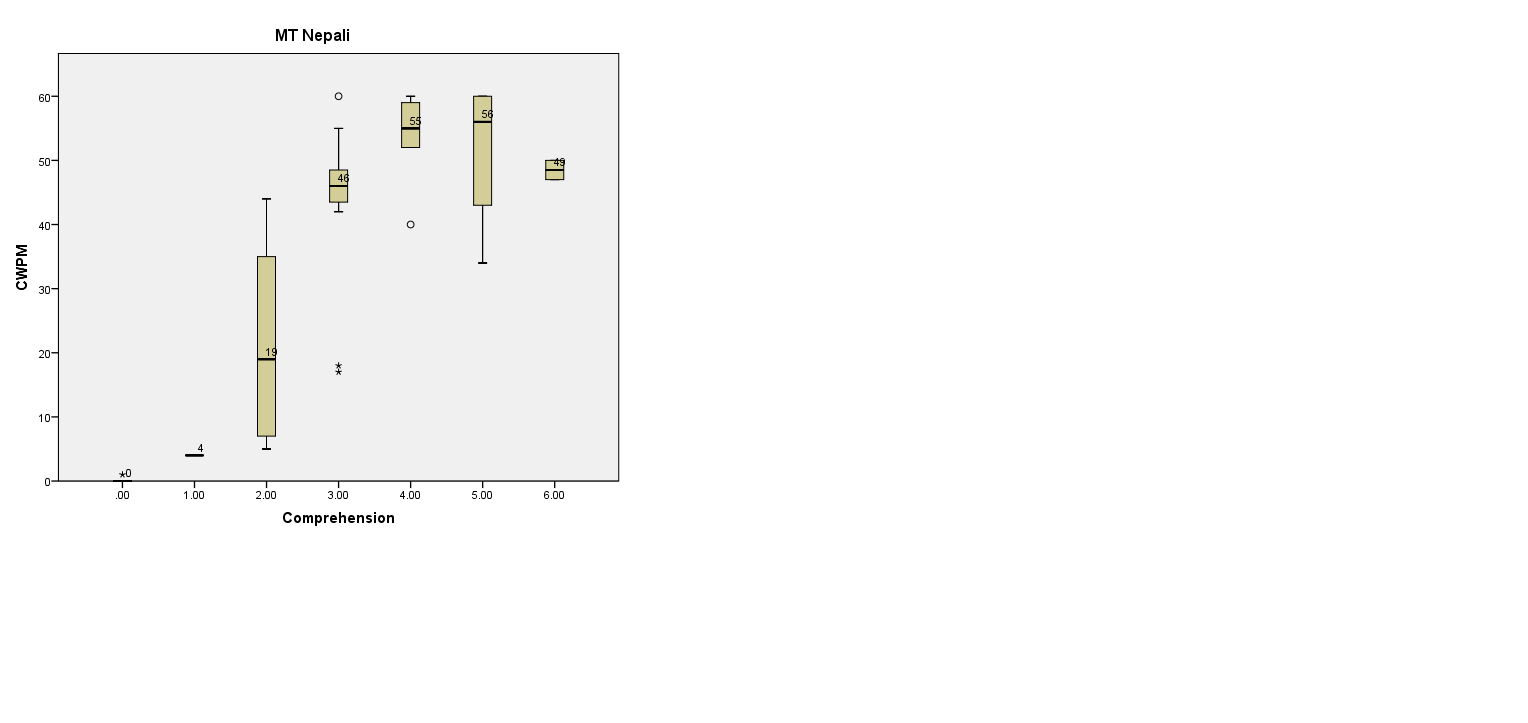
Figure 09: CWPM Vs Comprehension of ‘MT Nepali’ group
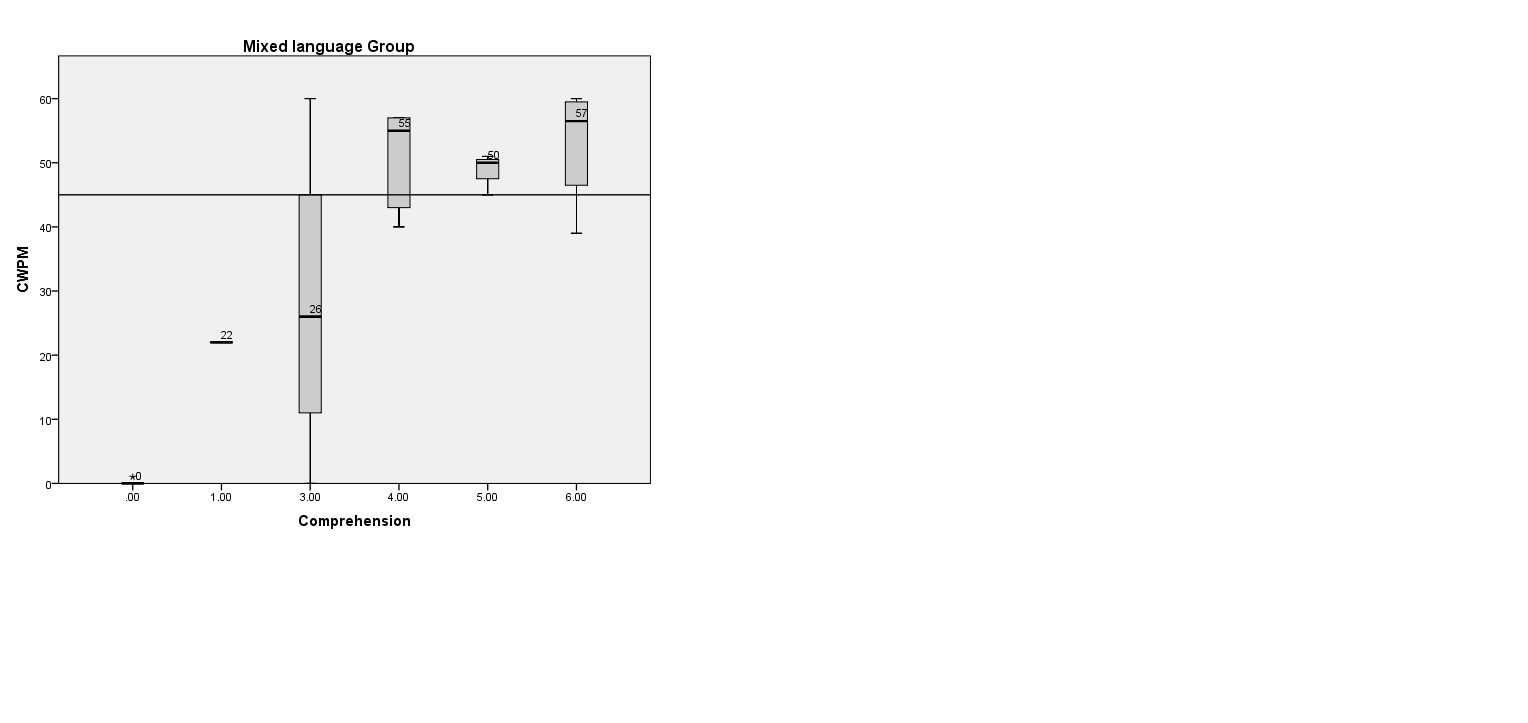 Figure 10: CWPM Vs Comprehension of ‘Mixed’ group
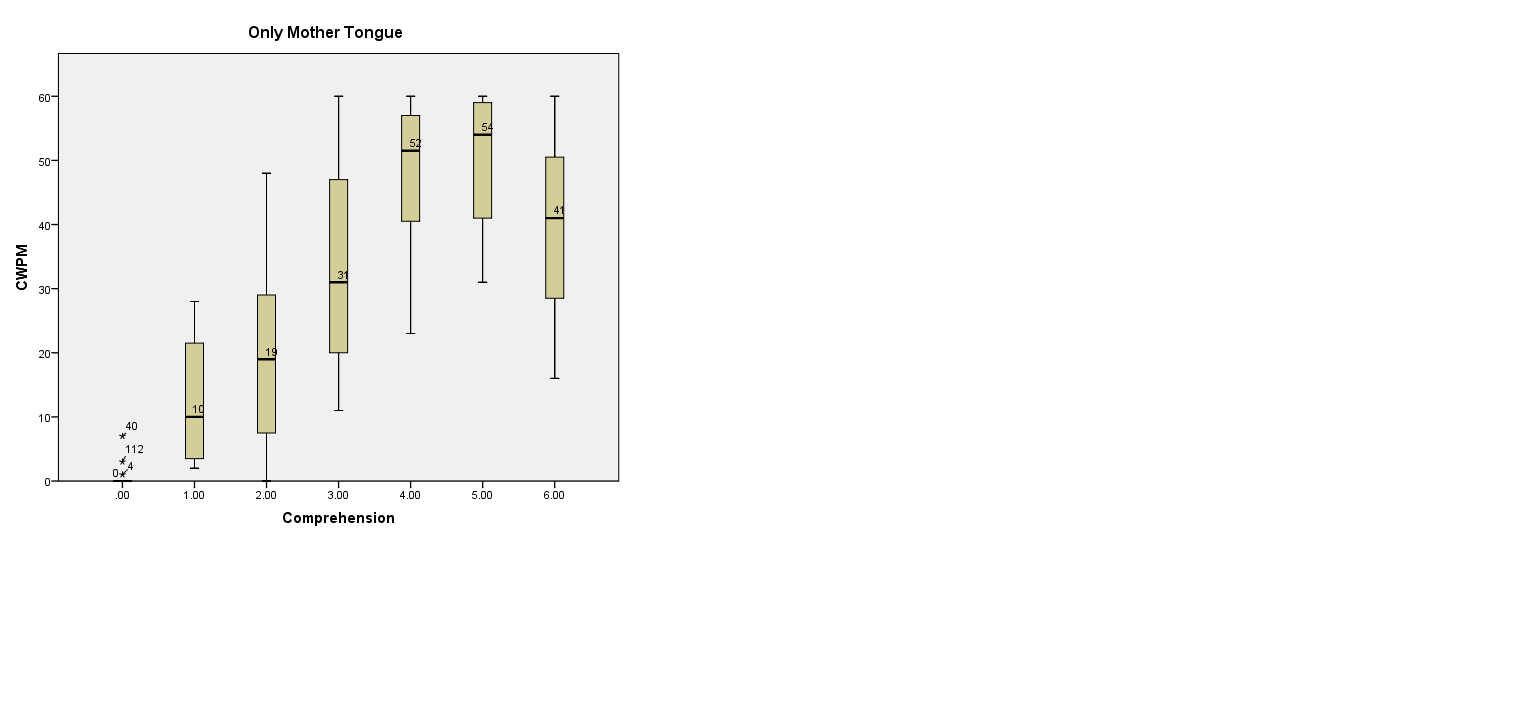 Figure 11: CWPM Vs Comprehension of ‘Only MT’ group
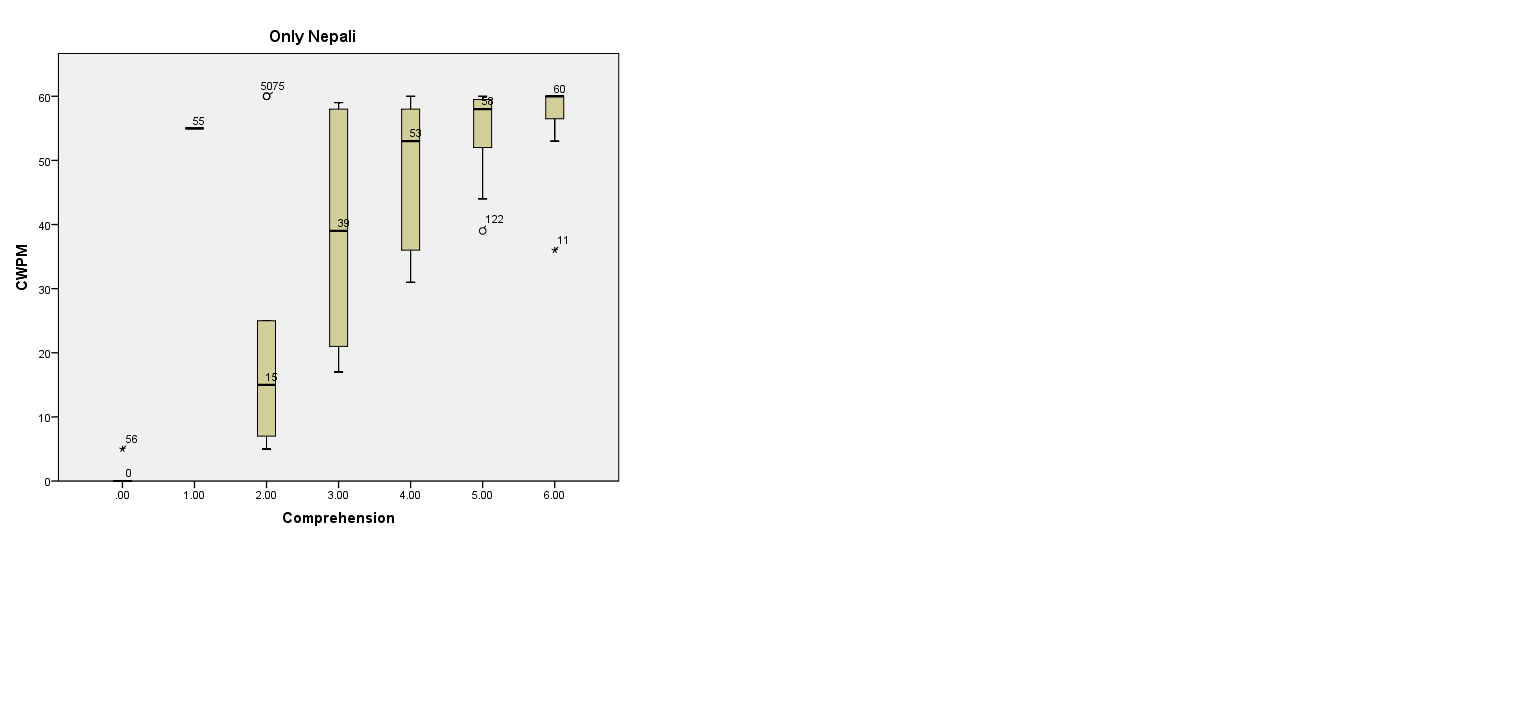 Figure 12: CWPM Vs Comprehension of ‘Only Nepali’ group
The children who can read 45 CWPM with 80% comprehension is a grade level benchmark for grade 3 children according to the Nepal government. The below figure shows that none of the Nepal Bhasa speaking children were able to meet a grade level benchmark whereas Nepali speaking children have better result than all other language speaking group which is 22.39%. Similarly, looking into a four major category, it is found that student who speak only mother tongue were far behind other language group in terms of achieving the grade level bench mark. Only 8% of the mother tongue speaking students was able to achieve grade level benchmark which is three times lesser than the highest achiever group.
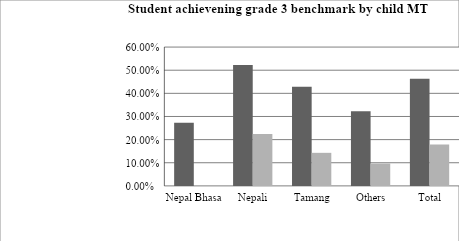
Figure 13: Student achieving grade level benchmark by child MT
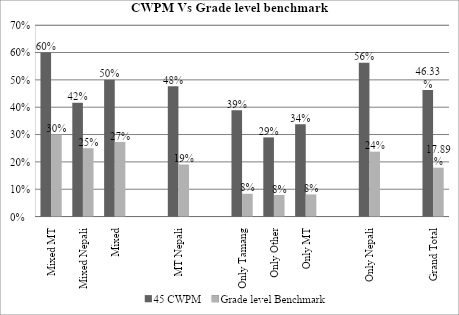
Figure 14: 45 CWPM Vs Grade level benchmark
One-way ANOVA test is carried out to compare the means of CWPM and Comprehension of four major category of language group of the children. While testing the significance of the CWPM between ‘Only Nepali Speaking’ group and other different language group, there found no significant difference between ‘Mixed’ group and ‘MT Nepali’ group. Whereas significant difference is found between ‘Only Nepali’ speaking group and ‘Only MT’ speaking group having p value 0.014<0.05. (Annex 2) This means there is significant difference in oral reading fluency between ‘Only Nepali’ speaking children and ‘Only MT’ speaking children of same grade. But, there are no significant different with, other two language groups; ‘Mixed’ and ‘MT Nepali’. Similarly, one way ANOVA is carried out to compare the means of comprehension of different language group. Test of significance it carried out for all four major groups. Looking into the significance difference between ‘Only Nepali’ speaking children and other three groups, there found no significance between ‘Only Nepali’ speaking groups with any other group. P value of the ‘Only MT’ speaking group is 0.056 which slightly higher than 0.05. This means there is no significant difference between any of the language group. This could also be the quality education issue in the community school of the Lalitpur Metropolitan city.
- DISCUSSION
The way parents communicate with their children during the early years has a lasting influence on language development and literacy outcomes. Therefore, students in this study were classified by combining the mother tongue (MT) of both parents and children. The findings revealed significant differences in reading achievement across language groups [19]. Approximately 40% of the world’s population lacks access to education in a language they understand, limiting their opportunities to build strong learning foundations [4,20]. The findings suggest that students in the Only MT group face a similar challenge. This group recorded the lowest performance across all reading indicators, with an average Oral Reading Fluency (ORF) score of 29.85 correct words per minute (CWPM), compared with 40.49 CWPM in the Only Nepali group [21]. Only 33.78% of students in the Only MT group met the national ORF benchmark, and just 8% achieved the grade-level comprehension target. Their average comprehension score was also the lowest (2.77 out of 6) [22]. Although Tamang-speaking students performed relatively better within this group, overall achievement remained below that of other language categories [12,23]. In contrast, the Only Nepali group demonstrated the strongest overall performance. Because Nepali is both their first language and the language of instruction, these students learn to read in a familiar linguistic environment [24]. More than half (56.25%) achieved the national ORF benchmark, with an average score of 40.49 CWPM. They also recorded the second-highest comprehension results, with an average score of 3.50 out of 6 [25]. A particularly interesting finding emerged from the Mixed MT subgroup, where parents speak different mother tongues and children speak one of them [21,26]. Despite growing up in multilingual environments, these students achieved the highest scores in both reading fluency and comprehension. Exposure to multiple languages may strengthen cognitive flexibility, perspective-taking, and communication skills [17,27]. However, because this subgroup included only 10 students, the findings should be interpreted cautiously and verified through larger studies [28]. Previous research has shown that children taught in a language different from their home language are more likely to experience lower achievement and higher rates of repetition and dropout. The results of this study support this view [11,29]. While 12.39% of all assessed students were unable to read a single word, the proportion was highest in the Only MT group (16.22%). Within this category, the Only Other MT subgroup recorded the highest percentage of non-readers (26.32%). In contrast, Tamang-speaking students showed a considerably lower rate of non-readers (5.56%), suggesting that factors such as language similarity, home exposure to Nepali, or bilingual environments may influence reading outcomes [29,30]. The findings also highlight a gap between reading fluency and comprehension. Although 46.33% of students achieved the national ORF benchmark, only 17.89% met the combined benchmark for both fluency and comprehension. This suggests that many students can read text accurately but struggle to fully understand its meaning. Such a gap may reflect broader concerns regarding instructional quality or the challenges students face when learning in a language that differs from their home language [31]. Overall, the study demonstrates that students whose mother tongue differs from the language of instruction achieve lower reading outcomes than those whose home language aligns with the school language. These findings indicate that language remains a significant barrier to equitable learning opportunities. Strengthening Mother Tongue-Based Multilingual Education (MTB-MLE) and promoting the use of mother tongue as a medium of instruction in early grades may help improve literacy outcomes and ensure more equitable access to quality education [32].
- CONCLUSION
This study was conducted in nine of the 40 community schools in Lalitpur Metropolitan City, involving 218 Grade 3 students. Permission was obtained from the respective school principals, and data were collected using Kobo Toolbox. Each assessment took approximately 5 to 7 minutes per student. The study was guided by the theory that learning to read in one’s mother tongue or first language supports better academic achievement than learning in a second language. Data were analyzed using Microsoft Excel and SPSS. Reading achievement was measured using the Oral Reading Fluency (ORF) and Reading Comprehension components of the Early Grade Reading Assessment (EGRA) developed by the Government of Nepal. The study aimed to assess students’ reading fluency and comprehension and compare their performance according to the language spoken at home. Based on the combined mother tongue profiles of parents and children, students were classified into four groups: Only MT, Mixed, Only Nepali, and MT Nepali. The findings showed notable differences in reading performance across groups. The Only MT group recorded the lowest average ORF score (29.85 correct words per minute), compared with 40.49 in the Only Nepali group, 36.09 in the Mixed group, and 34.93 in the MT Nepali group. A similar trend was observed in reading comprehension, where the Only MT group achieved the lowest mean score (2.77), compared with 3.50 for the Only Nepali group, 3.27 for the Mixed group, and 3.02 for the MT Nepali group. Achievement of the Grade 3 reading benchmark was also lowest among the Only MT group, with only 8% of students meeting the standard, compared with 24% in the Only Nepali group, 27% in the Mixed group, and 19% in the MT Nepali group. In addition, the proportion of non-readers, defined as students unable to read a single word, was highest in the Only MT group (16.22%), compared with 8.75% in the Only Nepali group, 13.64% in the Mixed group, and 11.90% in the MT Nepali group. Overall, students who spoke only their mother tongue at home performed less well in both ORF and comprehension assessments than their peers in other language groups. In contrast, students from the Only Nepali group consistently achieved the highest scores and were more likely to meet the expected Grade 3 reading benchmarks. These findings suggest that alignment between the language spoken at home and the language of instruction plays an important role in early-grade reading achievement.
- RECOMMENDATIONS
Government of Nepal has rectified more than two dozen of international human rights instruments in which majority of them talk about the language rights of children of diverse ethnic groups and linguistic minorities. But the proper framework on the implementation of the MTB education or MT as MoI is not in structure. As the government has realizes the essentiality of first language in school education, it has to ensure that school has been implementing the proper MTB-MLE framework and student speaking different language than that of the school’s language which is use as MoI, has a similar grade level achievement as of the child having same language as of school’s language use as MoI. MTB-MLE framework/guideline could be made as per the school type such as; homogeneous and heterogeneous language speaking student’s school, community and private school, etc. Teachers who are not aware about the MTB-MLE instruction should be trained on it. In teacher training programs, the inclusion of follow-up visits in school leads to higher learning gains. To bridge the gap between learning new methods in training and implementing them in practice, developing countries should make more use of follow-up visits in which trainers observe and support teachers in the classroom. This study has already proved the importance of the MT as a MoI for the early grades. For this, necessary child friendly learning material has to be developed with the help of the expert.Nowadays, there are many schools in English medium. Without knowing the complication of teaching the early child in the language which is total new to him/her, schools are in the race of implementing English medium school. And parents are fooled by their false advertisement. Therefore, there should be proper awareness campaign on the importance of MTB education or MT as MoI in education for the early grade student.
AUTHOR CONTRIBUTION STATEMENT
Nabina Bajracharya: Substantial contributions to the conception or design of the work; or the acquisition, analysis, or interpretation of data for the work, Drafting the work or reviewing it critically for important intellectual content; AND Final approval of the version to be published, and Agreement to be accountable for all aspects of the work in ensuring that questions related to the accuracy or integrity of any part of the work are appropriately investigated and resolved.
ACKNOWLEDGEMENTS: No specific individuals, institutions, or organizations contributed additional support or assistance requiring formal acknowledgement for this study.
DECLARATIONS:
Funding: This research received no specific grant, financial support, or funding from any public, commercial, or non-profit organization.
Conflicts Of Interest: The authors declare that there are no conflicts of interest, financial or otherwise, that could have influenced the research, analysis, or interpretation of the findings presented in this article.
Data Availability: The datasets and information used in this study are publicly available from the sources cited within the article. No proprietary or restricted data were used.
Generative AI Disclosure: Generative artificial intelligence tools were not used for generating research data, conducting analyses, or producing scientific conclusions in this study. The authors take full responsibility for the content and accuracy of the manuscript.
REFERENCES
- Scandurra, R., Kelly, D., Fusaro, S., Cefalo, R., & Hermannsson, K. (2024). Do employability programmes in higher education improve skills and labour market outcomes? A systematic review of academic literature. Studies in Higher Education, 49(8), 1381-1396. https://doi.org/10.1080/03075079.2023.2265425
- Monteiro, S., Santos, S., Teixeira, J. N., Torres, L., & Palhares, J. (2025). Determinants of higher education graduates’ employability: A scoping review. Education + Training, 67(1), 56-74. https://doi.org/10.1108/ET-04-2024-0190
- Tight, M. (2023). Employability: A core role of higher education? Research in Post-Compulsory Education, 28(4), 551-571. https://doi.org/10.1080/13596748.2023.2253649
- Alanazi, A. S., & Benlaria, H. (2023). Bridging higher education outcomes and labour market needs: A study of Jouf University graduates in the context of Vision 2030. Social Sciences, 12(6), 360. https://doi.org/10.3390/socsci12060360
- Iriondo, I. (2022). Graduate labour market outcomes and satisfaction with university education in Spain. PLOS ONE, 17(7), e0270643. https://doi.org/10.1371/journal.pone.0270643
- Portocarrero Ramos, H. C., Campos Trigoso, J. A., Caro, O. C., et al. (2025). Career paths and university education: Factors that determine the employment status of university graduates. Frontiers in Education, 10. https://doi.org/10.3389/feduc.2025.1664249
- Vlachopoulos, D., & Tsitiridou, O. P. (2026). Preparing university graduates for the labour market through employability skills development and university-industry collaboration: A systematic review. Education Sciences, 16(3), 426. https://doi.org/10.3390/educsci16030426
- Agezew, B. H., & Erdei, G. (2026). Pathways to graduates’ employability: Analysis of labor market outcomes in Ethiopian higher education and vocational training institutions. Frontiers in Education, 11. https://doi.org/10.3389/feduc.2026.1778312
- Conzelmann, J. G., Hemelt, S. W., Hershbein, B. J., Martin, S. M., Simon, A., & Stange, K. M. (2025). Grads on the go: Measuring college-specific labor markets for graduates. Journal of Policy Analysis and Management, 44(3), 741-763. https://doi.org/10.3386/w30088
- Riaz, N., Tarar, A. H., Tarar, M. A., & Arif, M. (2025). Examining the employability of university graduates in Pakistan: A study of skills and competencies.
- Dhakal, B. R. (2021). Mother tongue based multilingual education in Nepal. Scholars’ Journal, 4(1), 45-55. https://doi.org/10.3126/scholars.v4i1.42465
- Mouni, R. B. (2023). Ideologies of policy arbiters in mother tongue-based multilingual education policy in the Nepalese context. Journal of NELTA Gandaki, 6(1-2), 63-79. https://doi.org/10.3126/jong.v6i1-2.59739
- Tamang, D., & Pandey, G. P. (2025). Teachers’ preparations for implementing mother tongue-based multilingual education in teaching English. Studies in ELT and Applied Linguistics, 2(2), 55-69. https://doi.org/10.3126/seltal.v2i2.74080
- Poudel, P. P., & Choi, T. H. (2022). Discourses shaping the language-in-education policy and foreign language education in Nepal: An intersectional perspective. Current Issues in Language Planning, 23(5), 488-506. https://doi.org/10.1080/14664208.2021.2013063
- Vogelzang, M., Tsimpli, I. M., Balasubramanian, A., Panda, M., Alladi, S., Mukhopadhyay, L., Treffers-Daller, J., & Marinis, T. (2025). Effects of mother tongue education and multilingualism on reading skills in the regional language and English in India. TESOL Quarterly, 59(1), 448-475. https://doi.org/10.1002/tesq.3326
- Phyak, P., & Ojha, L. P. (2021). Language-in-education policy, multilingualism, and educational justice in Nepal. Language Policy, 20(4), 567-589. https://doi.org/10.1007/s10993-020-09576-5
- Benson, C., & Wong, K. (2021). Language issues and challenges in mother tongue-based multilingual education. Annual Review of Applied Linguistics, 41, 75-94. https://doi.org/10.1017/S0267190521000052
- Rai, A., & Pokharel, D. P. (2025). The dynamics of teachers’ instruction in Nepali classrooms. International Journal of Language Instruction, 4(1), 20-32. https://doi.org/10.54855/ijli.25412
- Long, K. A. (2026). Improving early grade reading for multilingual learners in English-medium classrooms: Evidence from the QondaRead programme in under-resourced schools in Makhanda, Eastern Cape. Reading & Writing, 17(1), Article 616. https://doi.org/10.4102/rw.v17i1.616
- Laksana, D. N. L., Bakti, C., Qondias, D., Veliz, L., Tam, C. C., Utami, K. H. D., & Listyana, I. G. A. P. (2025). Adapting mother tongue-based instructional models to address gender disparities in literacy and numeracy skills. International Journal of Language Education, 9(2), 377-391. https://doi.org/10.26858/ijole.v9i2.75115
- Chhetri, D. J. (2025). Reading comprehension in the Nepali EFL context: Challenges, strategies, and learner engagement. Siddhartha Journal of Academics, 7(1), 92-108. https://doi.org/10.3126/sja.v7i1.93703
- Marinis, T., Tsimpli, I. M., & Vogelzang, M. (2025). Multilingualism, mother tongue education, and literacy outcomes among primary school learners. TESOL Quarterly, 59(1), 448-475. https://doi.org/10.1002/tesq.3326
- De Houwer, A. (2021). Harmonious bilingual development and equitable educational opportunities. International Journal of Bilingual Education and Bilingualism, 24(8), 1115-1128. https://doi.org/10.1080/13670050.2019.1599821
- García, O., & Lin, A. M. Y. (2022). Translanguaging and multilingual education: Educational equity through linguistic inclusion. Language, Culture and Curriculum, 35(3), 245-259. https://doi.org/10.1080/07908318.2021.1932438
- Cummins, J. (2021). Rethinking the education of multilingual learners through mother tongue-based approaches. Multilingua, 40(6), 745-760. https://doi.org/10.1515/multi-2020-0098
- Benson, C., & Kosonen, K. (2022). Language issues in comparative education: Inclusive teaching and learning through multilingual education. Comparative Education Review, 66(3), 421-438. https://doi.org/10.1086/719785
- Mohanty, A. K. (2021). Multilingual education, language equity, and social justice. International Review of Education, 67(1-2), 35-56. https://doi.org/10.1007/s11159-021-09892-4
- Kirsch, C., & Duarte, J. (2021). Multilingual approaches for equitable education: A review of classroom practices. Language and Education, 35(5), 423-439. https://doi.org/10.1080/09500782.2020.1849867
- Sah, P. K., & Li, G. (2022). Translanguaging and multilingual language education in South Asia: Promise and challenges. TESOL Quarterly, 56(4), 1343-1361. https://doi.org/10.1002/tesq.3142
- Phyak, P. (2022). Language ideology, multilingualism, and educational justice in Nepal. Language Policy, 21(2), 211-230. https://doi.org/10.1007/s10993-021-09593-5
- Trudell, B., & Piper, B. (2021). Whatever the law says: Language policy implementation and early-grade literacy achievement in multilingual settings. Current Issues in Language Planning, 22(5), 515-532. https://doi.org/10.1080/14664208.2020.1860051
- Erling, E. J., & Seargeant, P. (2023). English medium instruction and language equity in multilingual societies. Applied Linguistics Review, 14(3), 501-522. https://doi.org/10.1515/applirev-2021-0107
Supplemental Material
No supplementary files, datasets, figures, or additional materials are associated with this study. Any information necessary to understand and evaluate the work is included in the main article.
Citation
Nabina Bajracharya (2026). Mother Tongue as Medium of Instruction for Equitable Access to Education. Dinkum Journal of Social Innovations, 5(01): 31-49. https://doi.org/10.71017/djsi.5.01.d-0576
DOI
https://doi.org/10.71017/djsi.5.01.d-0576
Identification
D-0576
Publication History
Submitted: 26-11-2025
Accepted: 28-01-2026
Published: 31-01-2026
Copyright
© The Author(s) 2026
Publishing License

 This is an Open Access article distributed under the terms of the Creative Commons Attribution (CC BY 4.0) License .