
Vol. 5 No.04 (2026) | Page: 295-317 |Original Article 
Factors Associated with Adherence to Antiretroviral Therapy Among People Living with HIV in the Antiretroviral Therapy Site of a Tertiary Hospital in Kathmandu
Liberty Shrestha 1*
-
- Department of Public Health, Nobel College, Sinamangal, (Pokhara University), Nepal.
 liberty.stha@gmail.com




ABSTRACT
Background: Antiretroviral therapy (ART) is treatment of people infected with human immunodeficiency virus (HIV) using anti-HIV drugs. The benefits of ART also include the prevention of HIV transmission by suppressing HIV replication in persons living with the virus.
Objective: This study assessed the proportion of Adherence to Antiretroviral Therapy and its Associated Factors among PLHIVs of the ART sites of a Tertiary Hospital in Kathmandu.
Methods: The quantitative cross-sectional analytical study design was adopted in the research study. Study setting was government ART sites of Kathmandu. The study population is people living with HIV(PLHIV) taking medicine in ART centers of Kathmandu. Interview was conducted through semi structured questionnaire. Consent was also taken fromthe participant before starting data collection.
Results: According to the results, there was 81.9 % adherence rate. The site of living (Kathmandu valley), among demographic factors, significantly affected adherence. (p-value=0.001). However, lower adherence rates were associated to adverse effect of drug (p- value= 0.019), and higher travel costs (p- value= 0.001).
Conclusion: The study has identified the adherence rate of 81.8% which seems encouraging although the ART adherence is challenging to all patients. Non-adherence has been associated to the existence of adverse drug effects.
Keywords: antiretroviral therapy adherence, people living with HIV (PLHIV), HIV treatment compliance, associated factors.
Key points:
- What proportion of people living with HIV adhere to antiretroviral therapy, and which factors influence adherence?
- Antiretroviral therapy adherence reaches 81.9% among people living with HIV receiving treatment.
- Reducing drug adverse effects and travel costs may improve antiretroviral therapy adherence among people living with HIV.
- INTRODUCTION
Human immunodeficiency virus (HIV) was an infection that attacks the body’s immune system, specifically the white blood cells called CD4 cells. HIV destroys these CD4 cells, weakening a person’s immunity against opportunistic infections, such as tuberculosis and fungal infections, severe bacterial infections and some cancers [1]. People at increased risk of acquiring should seek comprehensive and effective HIV prevention, testing and treatment services. HIV infection can be diagnosed using simple and affordable rapid diagnostic tests, as well as self-tests [2]. It was important that HIV testing service follow the 5Cs: consent, confidentiality, counselling, correct results and connection with treatment and other services. People diagnosed with HIV should be offered and linked to Antiretroviral treatment (ART) as soon as possible following diagnosis and periodically monitored using clinical and laboratory parameters, including the test to measure virus in the blood (viral load). If ART was taken consistently, this treatment also prevents HIV transmission to others [3]. At diagnosis or soon after starting ART, a CD4 cell count should be checked to assess a person’s immune status. The CD4 cell count is a blood test used to assess progression of HIV disease, including risk for developing opportunistic infection and guides the use of preventive treatment. The normal range of CD4 count is from 500 to 1500 cells/mm3 of blood, and it progressively decreases over time in persons who are not receiving or not responding well to ART. HIV viral load measures the amount of virus in the blood [4]. This test is used to monitor the level of viral replication and effectiveness of ART. The treatment goal is to reduce the viral load in the blood to undetectable levels (less than 50 copies/ml), and the persistent presence of detectable viral load (greater than 1000 copies/ml) in people living with HIV on ART is an indicator of inadequate treatment response and the need to change or adjust the treatment regimen. WHO’s 2022–2030 global health sector strategy on HIV aims to reduce HIV infections from 1.5 million in 2020 to 335 000 by 2030, and deaths from 680 000 in 2020 to under 240 000 in 2030. (WHO) [5]. Antiretroviral therapy (ART) is treatment of people infected with human immunodeficiency virus (HIV) using anti-HIV drugs. The standard treatment consists of a combination of drugs (often called “highly active antiretroviral therapy” or HAART) that suppress HIV replication. The combination of drugs is used in order to increase potency and reduce the likelihood of the virus developing resistance ART reduces mortality and morbidity rates among HIV-infected people and improves their quality of life. The benefits of ART also include the prevention of HIV transmission by suppressing HIV replication in persons living with the virus [6]. This benefit of ART is also defined as “undetectable equal un-transmittable”, or U=U. (PAHO/WHO). Dolutegravir (DTG) based regimen (TLD: tenofovir, lamivudine, Dolutegravir) is now the preferred first-line regimen in Nepal. Transition to the new regimen was the result of the finding of the HIV Drug Resistance study conducted by MoHP with support from WHO which showed resistance to the ARV drugs currently being used in Nepal and also based on recent WHO technical recommendation. (WHO). A patient’s ability to stick to a treatment plan, take drugs as directed, and abide by dietary and other medication limitations is referred to as adherence. Any chronic condition has adherence challenges, and a reported average non-adherence rate of 24.8% has been noted. [7] According to research by Paterson and colleagues, virological success requires adherence levels of at least 95%. However, virological failure—defined as a sharp increase in viral load—occurred in 22% of patients with adherence levels of over 95%, compared to 61% of patients with adherence levels of 80 to 94.9% and 80% of patients with adherence levels of less than 80%.For example, resistance to non-nucleoside reverse transcriptase inhibitors is substantially stronger at low levels of adherence than that for protease inhibitors; nevertheless, the link between adherence and the development of resistance varies per regimen [8]. An adherence rate of 86% was observed in mixed-method research conducted in Nepal in 2009 by Wasti et al. Similarly, Shigdel et al2012.’s study in the Kathmandu Valley revealed an adherence rate of 86.7% [10]. According to cross-sectional research conducted in 2015 by Bam et al. in Nepal, the adherence rate was 94.8%. Adherence is the degree to which a person’s actions, such as taking medicine, adhering to a diet, and/or modifying their lifestyle, are in line with the accepted recommendations of a health professional. In the absence of surroundings that are supportive of those living with HIV and when HIV-related stigma and prejudice are present, adhering to ART may also be difficult [11]. The intricacy of dosage regimens and negative side effects are two possible medication-related problems. Distance to healthcare facilities, lengthy wait times for appointments, only obtaining enough medication for one month, stock-outs at pharmacies, and the financial burden of direct and indirect healthcare expenditures are all aspects of the health system [12]. Poor adherence can cause the emergence of multi-drug-resistant versions of the virus and the virological failure of affordable first-line treatment regimens, culminating in a public health emergency. Both wealthy and developing nations face several obstacles to adherence, such as disclosure anxiety. Nevertheless, some of these are more prevalent in the developing Asian nations, such as the expenses related to ART (such as travel expenses and diagnostic fees) and the difficulties in traveling to receive care [13]. As a result, in order to profit from ART, it is crucial to recognize adherence behavior, understand the causes of non-adherence, and create strategies and social policies that will optimize adherence over the long run. Priority should be placed on strengthening adherence by regular follow-up, educating patients about ART treatment, including its advantages and side-effects, eliminating access barriers, and reducing the burden of expense [14]. Policymakers need to be aware of these major obstacles and take into account social policy that motivates patients to adhere to recommended standards. [15]. This research helped to contribute the HIV AIDS target of 95% of HIV infected people who know their status are on treatment by 2030. Between 2000 and 2021, globally, new HIV infections fell by 49%, and HIV-related deaths fell by 61% with 18.6 million lives saved due to ART in the same period (WHO) [16]. In December 2020, UNAIDS released a new set of ambitious targets calling for 95% of all people living with HIV to know their HIV status, 95% of all people with diagnosed HIV infection to receive sustained antiretroviral therapy, and 95% of all people receiving antiretroviral therapy to have viral suppression by 2025. (UNAIDS) By 2030, end the epidemics of AIDS, tuberculosis, malaria and neglected tropical diseases and combat hepatitis, water-borne diseases and other communicable diseases is the target of SDG [17]. The NCASC, MOHP Nepal had released a new National HIV Strategic Plan (NHSP) 2021-2026 which has the target of Treat 95 % of people diagnosed with HIV that helps to achieve vision of ending AIDS epidemic in Nepal by 2030. In the strategic priorities of National strategic plan, strategy 5.3, treatment, care and support, HIV-sensitive universal health coverage and social protection in all settings. The strategic actions help for treatment strengthening but these mostly does not address the difficulties to adhere ART by PLHIV [17]. This study helped to provide service to PLHIV by ART centers and hospitals through policy makers strengthening the policy and enhancing the implementation. This study also helped for further research in HIV and AIDS as a resource. The study were not done in Kathmandu addressing all government ART center. And this study covered all government ART centers of Kathmandu which helped to know the status of ART adherence and what factors affect the ART adherence. So that the related stakeholders can plan, according to the finding, to achieve the target. This also represented the sample of Nepal as the study. So, this study was conducted, and the anticipated outcomes demonstrated what needs to be addressed and/or encouraged to increase adherence. To assess the proportion of adherence to Antiretroviral Therapy and its associated factors among PLHIVs of the ART sites of a Tertiary Hospital in Kathmandu.
- MATERIALS AND METHODS
The cross-sectional analytical study design was adopted in the research study. The quantitative method was adopted in the research study. Study setting- The government ART sites, BIR Hospital, and Sukraraj Tropical Hospital in Kathmandu which are also known as Tertiary hospitals. It was the place where HIV-infected people take medicine. This hospital was the National referral center of Nepal. Maximum cases were referred to these hospitals. Most of the PLHIVs taking ART medicine were also in these hospitals. Here we can find the target population for the interview questionnaire. This was the place where we can find the percentage of adherence of HIV-infected people to Antiretroviral therapy medication. These Hospitals are the place where most people come for treatment, and for ART, people from different places come for their medication. Here, the people taking ART were in higher numbers than in other provinces, which created a situation for an ample sample size for the study, which helped to represent the nation. Study Population – PLHIV who were taking medicine in the ART center of BIR Hospital and Sukraraj Tropical and infectious disease Hospital in Kathmandu, at the time of data collection. The adult PLHIV of age 18 and above was taken in the sample. The sampling frame was the number of PLHIV who took medicine from Government ART sites, of BIR Hospital and Sukraraj Tropical and infectious disease Hospital in Kathmandu. The adult PLHIV of age 18 and above was taken in the sample. The study population were the people living with HIV (PLHIV) in the Government ART center BIR Hospital and Sukraraj Tropical and infectious disease Hospital in Kathmandu. A list of ART centers was obtained from the Website of the National Center for AIDS and STI Control for the sampling frame. The adult PLHIV of age 18 and above were taken in the sample. The list of PLHIVs who were taking medicine, from the selected ART center were obtained from the ART register or NCASC.
Table 01: Sampling Frame
| Age | Sukraraj tropical and infectious disease hospital (Teku) | Bir Hospital |
| 18 and
above |
No. of PLHIV= 2100 | No. of PLHIV=
425 |
The sample size was taken out by using the formula. The overall prevalence of PLHIV was generated from Shigdel et al2012.’s study in the Kahmandu Valley that revealed an adherence rate of 86.7%. While calculating the sample size, an allowable error was kept at 5% and the reliability coefficient at 95%. The required sample size for the structured interview was, calculated by taking prevalence data from the research by Shigdel et al 2012 and using the formula,
Sample size = (z² p*q/ d²) [18]
Where, Z = 1.96 reliability coefficient at alpha 0.05.
Prevalence (p) = 87% q = 1-p
= (1- 0.87)
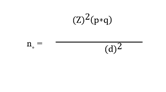
Allowable error (d) = 5% = 0.05 Applying the formula,
The required sample size for calculating the infinite population was calculated by considering the finite population,
Finite population (N) = 2525 which was the number of PLHIV taking medicine (ART) from government ART sites in Kathmandu (Sukraraj Tropical Hospital and BIR Hospital)

Now, putting the value in the formula
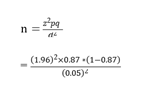
= 173.79
= 174
Where, p=87% Z= 1.96 d=0.05
Then, using the finite population formula
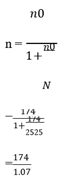
= 162.61 ~ 163
=163
Now, with 10% non-response rate 10% of 163
= 16.3
Then, 163+16.3
179.3 ~ 179
= 179 is the sample size
Therefore, 179 was the required sample size.
Table 02 Sampling Technique- Stratified Sampling with proportionate allocation.The formula for calculating the proportion from each stratum is 𝑛 =k which was multiplie.
Table 02: Sampling Technique- Stratified Sampling with proportionate allocation.
| Name of
ART sites |
No of PLHIV (18years
and above) = ni |
Proportion from each
Stratum |
Total sample from
each stratum |
| Teku
Hospital |
2100 | 179/2525*2100 | 148.87 ~ 149 |
| Bir hospital | 425 | 179/2525*425 | 30.13 ~ 30 |
| Total | 2525 (N) | 179 (n) |
From each stratum, PLHIVs were selected using simple random sampling.Data were collected from primary sources like interviews and questionnaires. The questionnaires were designed per the research topic, which helped to achieve the research objectives. The first section of the semi-structured questionnaire consists of a demographical study of respondents which included age group, gender, and educational qualification. The second section consist of questions related to different variables. And the adherence status was assessed by using the questionnaire developed by USAID.The age limit for PLHIV were 18 years and above, PLHIV enrolled and those who were taking ART in government ART centers, BIR Hospital and Sukraraj Tropical Hospital in Kathmandu and those who were presented at the time of data collection. Tool- Semi-structured questionnaire, Techniques- Face to Face Interview Interview was conducted through a semi-structured questionnaire. Tools was written in English, translated into Nepali, and then back into English. ARV Adherence was measured using the multi-method Adherence Assessment Tool developed and validated by USAID.Data were collected only after permission from Nobel College and NCASC and ART centers. A pre-tested semi-structured questionnaire was used for collecting quantitative data. Primary data were collected through an interview schedule. Informed consent was obtained from each respondent before the interview after explaining the purpose of the research. Consent was also taken fromthe participant before starting data collection.After data were collected and cleaned, data were edited and processed, and tabulated according to its requirements. Statistical Package for Social Sciences Software (SPSS)20 and MS Excel was used to analyze the collected data and maintain uniformity. Univariate analysis was done, and the results were described using frequency tables in numbers and percentage. Bivariate analysis was performed to examine the association between dependent and independent variables using Chi- square test. Multiple logistic regression model was used to identify the most important determinants for each outcome. A p- value of less than 0.05 was used to define statistical significance. Adjusted odds ratio (AOR) as well as their confidence intervals (95% CI) was used to depict the independent relationship between dependent and independent variable.
3.RESULTS & DISCUSSION
3.1 Sociodemographic information of Respondents
The table below shows the demographic details of study participants. There were 181 participants in the research, with 57.5% men and 42.5% women. The Brahmin/Chhetri ethnic group were the majority of participants (47.5%), followed by the Janajati (30.9%) and the Newar (9.4%). Hinduism was the most common identity among participants (86.7%), followed by Boudha (8.8%). Age-wise, the largest age group was 18-49 years (68%). The majority of individuals (76.2%) were employed, and 92.3% called Kathmandu residence.The majority of individuals had either a basic (32.6%) or secondary (36.7%) education. The majority of participants said service (55.2%) or business (22.7%) were the family’s primary sources of income. Less than Rs15,000 was the monthly family total income that was most prevalent (55.2%).In terms of at-risk groups, 5.5% of participants said they injected drugs, 1.7% said they were sex workers’ clients, and 1.1% said they had sex with males.
Table 03: Sociodemographic information of Respondents
| Category | Frequency | Percent (%) |
| Age in years | ||
| 18 to 24 | 14 | 7.7 |
| 25 to 34 | 40 | 21.1 |
| 35 to 44 | 52 | 28.7 |
| 45 to 54 | 40 | 22.1 |
| 55 and above | 35 | 19.3 |
| Sex | ||
| Female | 77 | 42.5 |
| Male | 104 | 57.5 |
| Ethnic group | ||
| Brahmin/Chhetri | 86 | 47.5 |
| Newar | 17 | 9.4 |
| Janajati | 56 | 30.9 |
| Dalit | 12 | 6.6 |
| Madhesi | 7 | 3.9 |
| Muslim | 2 | 1.1 |
| Others | 1 | 0.6 |
| Religion | ||
| Hindu | 157 | 86.7 |
| Boudha (Buddhist) | 16 | 8.8 |
| Muslim/Islam | 5 | 2.8 |
| Christian | 2 | 1.1 |
| Others | 1 | 0.6 |
| Marital status | ||
| Unmarried | 39 | 21.5 |
| Married | 97 | 53.6 |
| Divorced | 6 | 3.3 |
| Others | 39 | 21.5 |
| Level of education | ||
| No formal education | 36 | 19.9 |
| Basic education (1–8) | 70 | 38.7 |
| Secondary (9–12) | 59 | 32.6 |
| More than secondary (13 and above) | 16 | 8.8 |
| Family income source | ||
| Service | 100 | 55.2 |
| Business | 41 | 22.7 |
| Labour | 3 | 1.7 |
| Agriculture | 9 | 5 |
| Others | 28 | 15.5 |
| Other income source (n = 18) | ||
| No work | 2 | 11.1 |
| Home maker | 4 | 22.2 |
| House helper | 2 | 11.1 |
| Lease of residence | 3 | 16.7 |
| Remittance (by family member) | 7 | 38.9 |
| Family total income per month | ||
| Less than 15,000 | 100 | 55.2 |
| 16,000 to 30,000 | 49 | 27.1 |
| 31,000 and above | 32 | 17.7 |
| Employment status | ||
| Unemployed | 43 | 23.8 |
| Employed | 138 | 76.2 |
| Residence | ||
| Kathmandu valley | 167 | 92.3 |
| Out of Kathmandu valley | 14 | 7.7 |
| At-risk population | ||
| People who inject drugs (PWID) | 10 | 5.5 |
| Client of sex worker | 3 | 1.7 |
| Men having sex with men (MSM) | 2 | 1.1 |
| Migrants | 1 | 0.6 |
| Spouse of migrants | 1 | 0.6 |
| Others | 164 | 90.6 |
3.2 Adherence to ART n=181
Table 04: Adherence rate of the respondents.
| Frequency | Percent | |
| Non- adherence | 33 | 18.2 |
| Adherence | 148 | 81.8 |
| Total | 181 | 100.0 |
The above table 04 shows the frequency and percentage of ART adherence. There are 148 (18.2%) participants adherence to ART and 33 (18.2%) non- adherence to ART.
Table 05: Adherence rate of the respondents taking ARV from study site.
| Categories | Frequency | Percent |
| >95% | 148 | 81.8 |
| 80% to 95% | 33 | 18.2 |
| Total | 181 | 100.0 |
The above table 05 shows the frequency and percentage of ART adherence. There are 148 (18.2%) participants had their adherence level to more than 95% and 33 (18.2%) participants had their adherence level ranges from 80% to 95%.
3.3 Self-Report for ART adherence
According to the analysis in assessing adherence, if there is one ‘yes’ answer then the client is classified as being moderately adherent. The data shows that there is one ‘yes’ answer from one of the respondents so there is moderate adherence.
Table 06: Self Report for ART adherence
| Categories | Frequency | Percentage | ||
| NO | Yes | No | Yes | |
| Difficult to remember to take
your medicine |
181 | 0 | 100 | 0 |
| Sometimes stop taking your medicine, when
you feel better |
181 | 0 | 100 | 0 |
| Missed any of your doses in the
past four days |
180 | 1 | 99.4 | 0.6 |
| Stop talking medicine, sometimes if you
feel worse |
181 | 0 | 100 | 0 |
3.4 Visual Analog Scale
Table 07: Missed dose or took at wrong time in past 4days
| Missed dose or took at wrong time in past 4days | Frequency | Percent |
| No | 177 | 97.8 |
| Yes | 4 | 2.2 |
| Total | 181 | 100.0 |
This table 07 shows that the 97.8% adherence to treatment and 2.2% non-adherence.
3.5 Pill Identification
This table 08 shows the pill identification by respondents. 171 (94.5%) respondents don’t know the name of medicine, while 10 (5.5%) know the name of medicine. All respondents know the number of pills per dose. Only 5 (2.8%) correctly judged time of medicine.
Table 08: Pill Identification
| Categories | Frequency | Percentage | ||
| NO | Yes | No | Yes | |
| Know the name
of medicine by participants |
171 | 10 | 94.5 | 5.5 |
| Know the no. of pills per dose | 181 | 0 | 100 | 0 |
| Time the
medicine is taken |
181 | 0 | 100 | 0 |
| Participants can
say time of medicine |
181 | 0 | 100 | 0 |
| Judged correctly
time of medicine |
176 | 5 | 97.2 | 2.8 |
| Knows any
additional information |
181 | 0 | 100 | 0 |
Table 09: Time the medicine is taken
| Time the medicine is taken | Frequency | Percent |
| Morning (hour) | 3 | 1.7 |
| Evening (hour) | 178 | 98.3 |
| Total | 181 | 100.0 |
This table 09 shows the 178 (98.3%) respondents take their medicine at evening and 3 (1.7%) take at morning.
Table 10: Participants can say time of medicine
| Participants can say time of
Medicine |
Frequency | Percent |
| 6 | 1 | .6 |
| 7 | 4 | 2.2 |
| 8 | 38 | 21.0 |
| 9 | 122 | 67.4 |
| 10 | 12 | 6.6 |
| 11 | 4 | 2.2 |
This table 10 shows that majority, 122 (67.4%) respondents take their medicine at 9 o’clock followed by 38 (21.0%) respondents take medicine at 8 o’clock.
3.6 Reason for not taking medicine
Table 11: Reason for not taking medicine n=181
| Categories | Frequency | Percent |
| To avoid side effect | 1 | 4.3 |
| Going away from home for work and other reason | 5 | 21.7 |
| Forget to take medicine | 11 | 47.8 |
| Others | 6 | 26.1 |
| Total | 23 | 100.0 |
This table 11 shows the reason for not taking medicine. The majority, 11 (47.8%) said they forgot to take medicine.
3.7 Percentage of times the missed dose
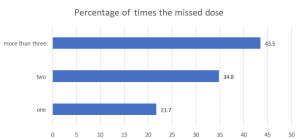
Figure 01: Percentage of time missed dose
This figure shows that majority, 43.5% missed more than three doses of medicine, 34% missed two doses, 21.7% missed one dose.
3.8 Bivariate Analysis
3.8.1 Socio-demographic Information with regards to ART adherence
This table 12 displays the findings of a research on the adherence to antiretroviral therapy (ART) among various demographic categories. Age, gender, ethnicity, religion, marital status, education, income, employment status, place of residence, and at-risk population were all taken into account when determining if there was a significant association between ART adherence and any of these variables using the Pearson chi-square test.According to the findings, out of total respondents, 33 respondents had non- adherence to ART whereas 148 respondents had adherence to ART. There was no association between ART adherence and any of the following factors: age, gender, religion, level of education, work position, or population at risk. However, there was a statistically significant association between ART adherence and residence (p=0.001).Among 148 respondents having adherence, 102 belonged to age group 18 to 49 years and 46 belonged to age group 50 years and above. Similarly, among 33 respondents having non- adherence, 21 belonged to age group 18 to 49 years and 12 belonged to age group 50 years and above. According to the data, there is no evidence of an association between ART adherence and age. Across all age categories, the non-adherence and adherence percentages are comparatively equal. p-value is 0.558.Out of 148 respondents having adherence, 61 belonged to female and 87 belonged to male. Among 33 respondents having non-adherence, 16 belonged to female whereas 17 belonged to male. In terms of adherence rates, there is no statistically significant difference between males and females. (P-value= 0.569)Comparing ethnic groupings, the Brahmin/Chhetri ethnic group has slightly higher rate of adherence (45.9%), although this difference is not statistically significant. (P-value= 0.483).There is no significant difference in ART adherence across different religions. (p-value is 1.000). The majority of individuals, regardless of their religion, are adherent to ART. Out of 148 adherent 128 were Hinduism and 20 were other religion. And, out of 33 non- adhere respondent, 29 were Hinduism and 4 were other religion. Out of 148 adherences, 29 has no formal education majority 62 respondents of basic education were adhere followed by secondary 43 and 14 were in the category more than secondary (13 and above). Similarly, out of 33 non- adherence respondents, majority 16 were of secondary and lowest 2 were more than secondary. The place of residence significantly influences ART adherence. P value is 0.001. Compared to people living elsewhere, individuals who live in Kathmandu valley have greater rates of adherence. Out of 148 adherences, 143 resided in Kathmandu valley and 5 out of Kathmandu valley. Similarly, out of 33 non- adherence respondents, 24 resided in Kathmandu valley and 9 out of Kathmandu valley.There is not a significant difference in ART adherence among those at risk, including drug users who inject drugs, sex workers’ customers, males who have sex with men, migrants, and wives of migrants. Most people in these groups have high rates of adherence. P-value is 0.757. Particularly, adherence rates were greater within the Brahmin/Chhetri ethnic group than among other groups. Individuals who were married had a higher rate of adherence than those who were unmarried or divorced. When compared to other sources, those who had their family income source of service had better rates of adherence. Comparatively to individuals with greater earnings, those with families earning less than 15000 NRS per month showed lower adherence rates. Finally, adherence rates were greater among individuals living in Kathmandu valley than among those living outside.
Table 12: Socio-demographic Information with regards to ART adherence
| Categories | ART Adherence | chi-square | P- Value | ||||
| Non- Adherence
No. (%) |
Adherence
No. (%) |
||||||
| Age | 0.344 | 0.558 | |||||
| 18 to 49 years | 21 (63.6%) | 102 (68.9%) | |||||
| 50 years and above | 12 (36.4%) | 46 (31.1%) | |||||
| Sex | 0.324 | 0.569 | |||||
| Female | 16 (48.5%) | 61 (41.2%) | |||||
| Male | 17 (51.5%) | 87 (58.8%) | |||||
| Ethnic group | 0.492 | 0.483 | |||||
| Brahmin/Chhetri | 18 (54.5%) | 68 (45.9%) | |||||
| Others ethnic group | 15 (45.5%) | 80 (54.1%) | |||||
| Religion | 0.000# | 1.000 | |||||
| Hindu | 29 (87.9%) | 128 (86.5%) | |||||
| Other religion | 4 (12.1%) | 20 (13.5%) | |||||
| Marital status | 1.032 | 0.794 | |||||
| Unmarried | 8 (24.2%) | 31 (20.9%) | |||||
| Married | 19 (57.6%) | 78 (52.7%) | |||||
| Divorced | 1 (3.0%) | 5 (3.4%) | |||||
| Other…. | 5 (15.2%) | 34 (23.0%) | |||||
| Education status | 0.414 | 0.520 | |||||
| No formal education | 7 (21.2%) | 29 (19.6%) | |||||
| Basic education (1-8) | 8 (24.2%) | 62 (41.9%) | |||||
| Secondary (9-12) | 16 (48.5%) | 43 (29.1%) | |||||
| More than secondary (13
and above) |
2 (6.1%) | 14 (9.5%) | |||||
| Family Income Source | 2.040 | 0.153 | |||||
| Service | 22 (66.7%) | 78 (52.7%) | |||||
| Business | 6 (18.2%) | 35 (23.6%) | |||||
| Others…. | 5 (15.2%) | 35 (20.6%) | |||||
| Family’s total income
(NRS) per month |
|||||||
| Less than 15000 | 15 (45.5%) | 85 (57.4%) | 0.360 | 0.548 | |||
| 16000 to 30000 | 13 (39.4%) | 36 (24.3%) | |||||
| 31000 and above | 5 (15.2%) | 27 (18.2%) | |||||
| Employment status | 0.089 | 0.765 | |||||
| Unemployed | 9 (27.3%) | 34 (23.0%) | |||||
| Employed | 24 (72.7%) | 114 (77.0%) | |||||
| Residence | 0.000# | 0.001 | |||||
| Kathmandu valley | 24 (72.7%) | 143 (96.6%) | |||||
| Out of Kathmandu
valley |
9 (27.3%) | 5 (3.4%) | |||||
| At risk population | 2.490 | 0.778 | |||||
| People who inject drug (PWID) | 3 (9.1%) | 7 (4.7%) | |||||
| Client of sex worker | 0 (0.0%) | 3 (2.0%) | |||||
| Men having sex with men (MSM) | 0 (0.0%) | 2 (1.4%) | |||||
| Migrants | 0 (0.0%) | 1 (0.7%) | |||||
| Spouse of migrants | 0 (0.0%) | 1 (0.7%) | |||||
| Others | 30 (90.9%) | 134 (90.5%) | |||||
Note: # indicated Fisher Exact test
3.8.2 Internal Factors in regards with regard to ART adherence
This table 13 shows the findings of a study on antiretroviral therapy (ART) adherence and non-adherence among people with HIV/AIDS in association to internal variables such the availability of nutritious food, coinfection, and forms of coinfection. The availability of nutritious food and treatment adherence are not associated. The 97% of those who said they had access to nutritious food showed non-adherence to treatment. On the other hand, every person who stated they have access to nutritious food showed signs of treatment adherence. There was no statistical significance difference between adherence and food availability is indicated by the p-value of 0.182. The relationship between coinfection and ART adherence was insignificant. The majority of those without coinfection (91.9%) exhibited adherence, but a lower proportion of those with coinfection (8.1%) did as well. P value is 1.000. Genital herpes and TB had the highest rates of non-adherence, however the forms of coinfection among individuals who had them varied.
Table 13: Internal Factors with regards to ART adherence n=181
| Categories | Non- Adherence | Adherence | chi-square | P- Value | |||
| Internal Factors | |||||||
| Availability of nutritious food | 0.000# | 0.182 | |||||
| No | 1 (3.0%) | 0 (0.0%) | |||||
| Yes | 32 (97.0%) | 148 (100.0%) | |||||
| Coinfection | 0.000# | 1.000 | |||||
| No | 31 (93.9%) | 136 (91.9%) | |||||
| Yes | 2 (6.1%) | 12 (8.1%) | |||||
| If Yes, types | 2.657 | 0.448 | |||||
| hepatitis A, B, C | 0 (0.0%) | 1 (8.3%) | |||||
| genital herpes | 1(50.0%) | 1 (8.3%) | |||||
| tuberculosis | 0 (0.0%) | 2 (16.7%) | |||||
| Others …. | 1 (50.0%) | 8 (66.7%) | |||||
Note: # indicated Fisher Exact test
3.8.3 External Factors in regards with ART adherence
This table 14 shows the findings of a study on antiretroviral therapy (ART) adherence and non-adherence among people with HIV/AIDS in association to external variables such,Distance to ART Center: According to the research, there is no significant association between treatment adherence and the distance to an ART clinic or hospital. (p-value= 0.308) In comparison, 69.7% of those who traveled for more than 30 minutes were non-adherent compared to 30.3% of people who traveled for less than 30 minutes.Stigma and discrimination: The presence of stigma and discrimination and treatment adherence are not significantly associated. (p- value= 1.000). Ten percent of those who said they had experienced stigma and discrimination were adherent, compared to 9.1% of non-adherents.Presence of adverse effects of drugs: Out of 148 adherences, 143 don’t have adverse effect of drug and 5 has adverse effect of drug. Similarly, out of 33 non- adherence respondents, 28 don’t have adverse effect of drug and 5 has adverse effect of drug. The data shows a significant association between adverse effects of drugs and treatment adherence. (p-value= 0.019).The findings indicate a significant association between certain types of side effects and treatment adherence among people who reported experiencing side effects. (p-value= 0.040). Types of side effects as vomiting, vertigo, headache, and body pain.There is a significant association between travel cost and treatment adherence. (p-value= 0.001). Individuals with travel costs less than Rs 500 demonstrated higher adherence (93.2%), while those with costs above Rs 500 showed lower adherence (6.8%). And, out of 33 non adhere respondents, 24 were with travel cost less than Rs 500 and 9 were with more than Rs 500.The data indicates no significant association between nutrition cost and treatment adherence. (p-value= 0.82). Out of 148 adherences, 82 were with nutrition cost less than Rs 5000 and 10 were with more than Rs 5000. Similarly, out of 33 non- adherence respondents,There is no significant association between the level of family support and treatment adherence. (p-value= 0.979). Out of 148 adherent respondents, 51 were with no support, 23 were with little support, and 74 were with more support. Similarly, out of 33 non- adherent respondents, 12 were with no support, 5 were with little support, and 16 were with more support.The data suggests no significant association between community support and treatment adherence. (p-value=0.267). Out of 148 adherent respondents, 125 were with no support, 14 were with little support, and 9 were with more support. Similarly, out of 33 non- adherent respondents, 31 were with no support, 2 were with little support, and 0 were with more support.All participants reported that they were listened to, and their problems were understood by the ART counselor.All participants reported excellent behavior from the service providers.There is no significant association between the environment of the ART center and treatment adherence. (p-value= 0.507). The individuals who said the environment as good had 77% of treatment adherence and wo said satisfactory had 23% of treatment adherence.
Table 14: External Factors in regards with ART adherence n=181
| Categories | Non- Adherence | Adherence | Chi-square | P- Value |
| External factor | ||||
| Distance to ART
center/ Hospital |
1.040 | 0.308 | ||
| Less than 30 minutes | 10 (30.3%) | 59 (30.3%) | ||
| More than 30 minutes | 23 (69.7%) | 89 (60.1%) | ||
|
Presence of stigma and discrimination |
0.000 |
1.000 |
||
| No | 30 (90.9%) | 133 (89.9%) | ||
| Yes | 3 (9.1%) | 15 (10.1%) | ||
| Source of stigma | 0.944 | 0.624 | ||
| Friends | 0 (0.0%) | 2 (14.3%) | ||
| Society | 1 (33.3%) | 2 (14.3) | ||
| Hospital | 2 (66.7%) | 10 (71.4%) | ||
| Presence of adverse
effect of drug |
0.000# | 0.019 | ||
| No | 28 (84.8%) | 143 (96.6%) | ||
| Yes | 5 (15.2%) | 5 (3.4%) | ||
| If Yes, types | ||||
| Side effect by medicine | 10.000 | 0.040 | ||
| Vomit | 1(20.0%) | 0 (0.0%) | ||
| Vertigo | 4 (80.0%) | 0 (0.0%) | ||
| Headache | 0 (0.0%) | 1 (20.0%) | ||
| Body pain | 0 (0.0%) | 1 (20.0%) | ||
| Others …. | 0 (0.0%) | 3(60.0%) | ||
| Trave cost | 12.088 | 0.001 | ||
| Less than Rs 500 | 24 (72.7%) | 138 (93.2%) | ||
| More than Rs 500 | 9 (27.3%) | 10 (6.8%) | ||
| Nutrition cost | 0.052 | 0.82 | ||
| Less than Rs 5000 | 19 (57.6%) | 82 (55.4%) | ||
| More than Rs 5000 | 14 (42.4%) | 66 (44.6%) | ||
| If married partner’s
behavior |
||||
| Reminding of
medication time |
0.022 | 0.883 | ||
| No | 19 (57.6%) | 90 (60.8%) | ||
| Yes | 14 (42.4%) | 58 (39.2%) | ||
| Supports to raise
children |
0.000 | 0.999 | ||
| No | 17 (51.5%) | 79 (53.4%) | ||
| Yes | 16 (48.5%) | 69 (46.6%) | ||
| Stands when community
discriminate |
0.032 | 0.857 | ||
| No | 18 (54.5%) | 86 (58.1%) | ||
| Yes | 15 (45.5%) | 62 (41.9%) | ||
| Family support | 0.043 | 0.979 | ||
| No | 12 (36.4%) | 51 (34.5%) | ||
| Little support | 5 (15.2%) | 23 (15.5%) | ||
| More support | 16 (48.5%) | 74 (50.0%) | ||
| Community support | 2.641 | 0.267 | ||
| No | 31 (93.9%) | 125 (84.5%) | ||
| Little support | 2 (6.1%) | 14 (9.5%) | ||
| More support | 0 (0.0%) | 9 (6.1%) | ||
| Listens to participant | ||||
| No | 0 | 0 | ||
| Yes | 33 (100.0%) | 148 (100.0%) | ||
| Can say participant’s
problems |
||||
| No | 0 | 0 | ||
| Yes | 33 (100.0%) | 148 (100.0%) | ||
| Respect of participants
by ART counselor |
||||
| Yes | 33 (100.0%) | 148 (100.0%) | ||
| Service provider’s
behaviour |
||||
| Excellent | 33 (100%) | 148 (100%) | ||
| Not excellent | 0 | 0 | ||
| Environment of ART
center |
0.440 | 0.507 | ||
| Good | 23 (69.7%) | 114 (77.0%) | ||
| Satisfactory | 10 (30.3%) | 34 (23.0%) | ||
Note: # indicated Fisher Exact test
3.9 Multivariate Analysis
3.9.1 Multivariate Unadjusted OR and Adjusted
The table 15 shows the results of a logistic regression analysis of the association between various variables and ART adherence. The variables included in the analysis are residence, travel cost, and adverse effect of drugs. For each variable, the table shows the unadjusted/ crude odds ratio (OR), 95% confidence interval (CI), and p-value, as well as the adjusted OR, 95% CI, and p-value. The adjusted ORs were calculated after controlling for other variables in the model.There were 10.725 times odds ART adherence for Kathmandu valley residence compared to that of out of Kathmandu valley residence without adjusting the effects of other explanatory variables (OR =10.725; CI = 3.310 – 34.750). After adjusting for the effects of other explanatory variables, the odds of ART adherence for Kathmandu valley residence had 8.407 times odds compared to out of Kathmandu valley residence (OR = 8.407; CI= 1.371- 51.570), p=0.021). After adjusting for the effect of other explanatory variables, there is significant association between ART adherence and Kathmandu valley residence.There were 5.175 times odds ART adherence for less than Rs 500 compared to that of a more than Rs 500 without adjusting the effects of other explanatory variables (OR =5.175; CI = 1.905-14.059). After adjusting for the effects of other explanatory variables, the odds of ART adherence for less than Rs 500 had 1.270 times odds compared to more than Rs 500 (OR = 1.270; CI= 0.228- 7.068), p= 0.785). After adjusting for the effect of other explanatory variables, the travel cost did not show any significant association with ART adherence. The confounding factors may have affected the travel cost.There were 5.107 times odds ART adherence for no adverse effect of drug compared to that of a yes adverse effect of drug (people who said they had adverse effect of drug) without adjusting the effects of other explanatory variables (OR =05.107; CI = 1.386-18.816). After adjusting for the effects of other explanatory variables, the odds of ART adherence for no adverse effect of drug had 4.589 times odds compared to yes adverse effect of drug (OR = 4.589; CI= (1.123- 18.762), p= 0.034), and showed significant association.
Table 15: Multivariate Unadjusted OR and Adjusted OR n=181
| Variable | ART adherence | Unadjusted OR (95% CI) | P-
Valu e |
Adjusted OR (95% CI) | P-
Valu e |
|
| Non-adherenc
e |
Adherenc e | |||||
| Residence | ||||||
| Kathmand
u valley |
24
(72.7%) |
143
(96.6%) |
10.725(3.310,
34.750) |
0.001 | 8.407(1.37
1, 51.570) |
0.021 |
| Out of
Kathmand u valley |
9 (27.3%) | 5 (3.4%) |
Ref |
|||
| Travel
cost |
||||||
| Less than
Rs 500 |
24
(72.7%) |
138
(93.2%) |
5.175(1.905,14.05
9) |
0.001 | 1.270(0.22
8, 7.068) |
0.785 |
| More than
Rs 500 |
9 (27.3%) | 10 (6.8%) | Ref | |||
| Adverse effect of
drug |
||||||
| No | 28
(84.8%) |
143
(96.6%) |
5.107 (1.386,
18.816) |
0.014 |
4.589(1.12
3, 18.762) |
0.034 |
| Yes | 5 (15.2%) | 5 (3.4%) | Ref | |||
- DISCUSSION
ART adherence is essential for effective HIV/AIDS management. This study examined factors associated with adherence among people living with HIV in Nepal. The adherence rate was 81.8%, with residence significantly associated with adherence: participants in Kathmandu were more adherent than those living elsewhere [19]. Age, gender, at-risk population, education, and religion showed no significant associations. These findings generally align with previous studies in Thailand, Nepal, and other Asian countries [20]. The results also showed significant associations between adherence, drug side effects, and travel costs. However, co-infection, distance to ART centres, stigma and discrimination, nutrition costs, family and community support, and the ART-centre environment were not significantly associated with adherence [21]. Unexpectedly, participants who reported access to nutritious food had higher non-adherence rates. This finding differs from common expectations and requires further investigation [22]. Although non-adherence was more common among participants with co-infections or longer travel times, neither factor had a statistically significant association with adherence. Participants who experienced drug side effects were more likely to be non-adherent. Vomiting, dizziness, headaches, and body pain were among the reported effects associated with adherence. These findings highlight the importance of monitoring and managing side effects to support continued treatment [23]. After adjustment for other variables, the associations between travel costs and adherence were no longer statistically significant. Residence and drug side effects remained significant, although their effects were weaker. Overall, the findings point to the importance of addressing location-related barriers and managing treatment side effects when supporting ART adherence. [24]
- CONCLUSION
The study has identified the adherence rate of 81.8% which seems encouraging although the ART adherence is challenging to all patients. Non-adherence has been associated to the existence of adverse drug effects. It seems sense that having unpleasant side effects might make it difficult for people to continuously follow their ART treatment. Place of residence has shown the influence on adherence of ART. The factors related to place of living may relate as non-adherence which may be access to health care facilities or social support. The other reasons respondents have missed the dose were forgot to take medicine, personal reasons, and went out of residence for work or other reasons. Understanding and assessing the issues ARV medication users face might help them attain ART-related objectives and solve ART-related issues in a reasonable manner. In conclusion, an increase in the adherence rate of PLHIV can be attributed through the development of supporting environments and appropriate social policies. Patients who are effectively and appropriately monitored for non-adherence behaviors can increase the levels of adherence, which improves treatment outcomes. Educating patients about the advantages of using ART, reducing side effects, removing access issues, and minimizing the effect of cost can enhance the ART adherence.
- RECOMMENDATION
To further understand the underlying causes of this unexpected connection, more study is required. Even though a smaller percentage of those with coinfections showed adherence, the connection overall was not statistically significant.These results imply that some side effects may affect adherence more so than others. Future studies should look for ways to reduce these side effects that affect adherence.An increase in the adherence rate of PLHIV can be attributed through the development of supporting environments and appropriate social policies.Patients who are effectively and appropriately monitored for non-adherence behaviors can increase the levels of adherence, which improves treatment outcomes.Priority should be given to enhancing adherence by regular follow-up and educating patients about the advantages of using ART, reducing side effects, removing access issues, and minimizing the effect of cost.The place of residence showed the significant association with ART adherence, so the strategy to increase ART adherence should be focused also on the place of residence. And the health services and facilities should be reached in all the district and community of country. Community lead treatment program should be made effective.
AUTHOR CONTRIBUTION STATEMENT
Liberty Shrestha: Substantial contributions to the conception or design of the work; or the acquisition, analysis, or interpretation of data for the work, Drafting the work or reviewing it critically for important intellectual content; AND Final approval of the version to be published, and Agreement to be accountable for all aspects of the work in ensuring that questions related to the accuracy or integrity of any part of the work are appropriately investigated and resolved.
ACKNOWLEDGEMENTS: No specific individuals, institutions, or organizations contributed additional support or assistance requiring formal acknowledgement for this study.
DECLARATIONS:
Funding: This research received no specific grant, financial support, or funding from any public, commercial, or non-profit organization.
Conflicts Of Interest: The authors declare that there are no conflicts of interest, financial or otherwise, that could have influenced the research, analysis, or interpretation of the findings presented in this article.
Data Availability: The datasets and information used in this study are publicly available from the sources cited within the article. No proprietary or restricted data were used.
Trial Registration: Trial registration is not applicable to this study, as it does not involve clinical trials, human participants, or experimental interventions.
Generative AI Disclosure: Generative artificial intelligence tools were not used for generating research data, conducting analyses, or producing scientific conclusions in this study. The authors take full responsibility for the content and accuracy of the manuscript.
REFERENCES
- Bondarchuk, C. P., Mlandu, N., Adams, T., & de Vries, E. (2022). Predictors of low antiretroviral adherence at an urban South African clinic: A mixed-methods study. Southern African Journal of HIV Medicine, 23(1), Article a1343. https://doi.org/10.4102/sajhivmed.v23i1.1343
- Buh, A., Deonandan, R., Gomes, J., Krentel, A., Oladimeji, O., & Yaya, S. (2023). Barriers and facilitators for interventions to improve ART adherence in Sub-Saharan African countries: A systematic review and meta-analysis. PLOS ONE, 18(11), e0295046. https://doi.org/10.1371/journal.pone.0295046
- Gobezie, M. Y., Tesfaye, N. A., Solomon, T., Demessie, M. B., Wendie, T. F., Kassa, T. D., & Berhe, F. T. (2024). Exploring optimal HAART adherence rates in Ethiopian adults: A systematic review and meta-analysis. Frontiers in Public Health, 12, 1390901. https://doi.org/10.3389/fpubh.2024.1390901
- Hlophe, L. D., Tamuzi, J. L., Shumba, C. S., & Nyasulu, P. S. (2023). Barriers and facilitators to anti-retroviral therapy adherence among adolescents aged 10 to 19 years living with HIV in sub-Saharan Africa: A mixed-methods systematic review and meta-analysis. PLOS ONE, 18(5), e0276411. https://doi.org/10.1371/journal.pone.0276411
- Isika, A. I., Adamu, A. S., Dahiru, T., Obi, I. F., Oku, A. O., Balogun, M. S., & Etokidem, A. (2022). Factors influencing adherence to antiretroviral therapy among HIV-infected adults in Cross River State, Nigeria: A cross-sectional study. Pan African Medical Journal, 43, 187. https://doi.org/10.11604/pamj.2022.43.187.37172
- Mate, K. K. V., Engler, K., Lessard, D., & Lebouché, B. (2023). Barriers to adherence to antiretroviral therapy: Identifying priority areas for people with HIV and healthcare professionals. International Journal of STD & AIDS, 34(10), 677–686. https://doi.org/10.1177/09564624231169329
- Msosa, T. C., Swai, I., Aarnoutse, R., Rinke de Wit, T. F., Ngowi, K., Msefula, C., Nliwasa, M., & Sumari-de Boer, M. (2024). The effect of real-time medication monitoring-based digital adherence tools on adherence to antiretroviral therapy and viral suppression in people living with HIV: A systematic literature review and meta-analysis. Journal of Acquired Immune Deficiency Syndromes, 96(5), 411–420. https://doi.org/10.1097/QAI.0000000000003449
- Sun, L., Qu, M., Chen, B., Li, C., Fan, H., & Zhao, Y. (2023). Effectiveness of mHealth on adherence to antiretroviral therapy in patients living with HIV: Meta-analysis of randomized controlled trials. JMIR mHealth and uHealth, 11, e42799. https://doi.org/10.2196/42799
- Keene, C. M., Sabin, L. L., Jennings, L., Schreuder, C., Källström-Ståhlgren, C. O., Katz, I. T., et al. (2025). Oral antiretroviral adherence interventions in the era of U=U. The Lancet HIV, 12(8), e587–e595. https://doi.org/10.1016/S2352-3018(25)00096-7
- (2024). Global HIV programme: HIV treatment and care. World Health Organization. https://www.who.int
- Joint United Nations Programme on HIV/AIDS (UNAIDS). (2024). Global AIDS update 2024. UNAIDS. https://www.unaids.org
- Joint United Nations Programme on HIV/AIDS (UNAIDS). (2023). The path that ends AIDS: Global AIDS update 2023. UNAIDS. https://www.unaids.org
- Nepal Health Research Council. (2023). National HIV estimates report 2023. NHRC.
- National Centre for AIDS and STD Control (NCASC). (2024). Country progress report on HIV/AIDS response, Nepal. Ministry of Health and Population, Nepal.
- Panel on Antiretroviral Guidelines for Adults and Adolescents. (2025). Guidelines for the use of antiretroviral agents in adults and adolescents with HIV. U.S. Department of Health and Human Services. https://clinicalinfo.hiv.gov
- Achappa, B., Madi, D., Bhaskaran, U., Ramapuram, J. T., Rao, S., & Mahalingam, S. (2021). Adherence to antiretroviral therapy among people living with HIV: A cross-sectional study from India. HIV/AIDS – Research and Palliative Care, 13, 455–462.
- Areri, H. A., Marshall, A., Harvey, G., & Gebretensaye, T. (2022). Factors affecting adherence to antiretroviral therapy among adults living with HIV in low- and middle-income countries: A systematic review. Journal of Multidisciplinary Healthcare, 15, 1343–1358.
- Mensah, K. B., Agyemang, D. O., & Okyere, P. (2021). Determinants of adherence to antiretroviral therapy among HIV-positive adults attending ART clinics. BMC Infectious Diseases, 21, 1189.
- Sewale, Y., Hailu, M., & Debela, D. (2022). Medication adherence and associated factors among adult HIV patients receiving antiretroviral therapy. HIV/AIDS – Research and Palliative Care, 14, 233–242.
- Suryana, K., Suharsono, H., & Merati, T. P. (2021). Factors associated with adherence among people living with HIV receiving antiretroviral therapy in Indonesia. HIV/AIDS – Research and Palliative Care, 13, 739–748.
- Alenezi, S. G., Alenezi, F. S., & Alamri, A. S. (2023). Factors associated with non-adherence to antiretroviral therapy among adults living with HIV: A cross-sectional analysis. BMC Public Health, 23, 1358.
- Chirwa, G. C., Sithole, B., & Jemu, M. (2024). Predictors of optimal adherence to antiretroviral therapy among adults living with HIV in sub-Saharan Africa. BMC Infectious Diseases, 24, 412.
- Fauk, N. K., Mwanri, L., Ward, P. R., & Hawke, K. (2024). HIV-related stigma and adherence to antiretroviral therapy: A systematic review. AIDS Care, 36(4), 421–432.
- Wasti, S. P., Simkhada, P., Randall, J., Freeman, J. V., & van Teijlingen, E. (2022). Factors influencing adherence to antiretroviral treatment among people living with HIV in Nepal and South Asia: An updated review. Global Health Action, 15(1), 2034567.
Supplemental Material
No supplementary files, datasets, figures, or additional materials are associated with this study. Any information necessary to understand and evaluate the work is included in the main article.
Citation
Liberty Shrestha (2026). Factors Associated with Adherence to Antiretroviral Therapy Among People Living with HIV in the Antiretroviral Therapy Site of a Tertiary Hospital in Kathmandu. Dinkum Journal of Medical Innovations, 5(04): 295-317. https://doi.org/10.71017/djmi.5.04.d-0603
DOI
https://doi.org/10.71017/djmi.5.04.d-0603
Identification
D-0603
Publication History
Submitted: 28-03-2026
Accepted: 28-04-2026
Published: 30-04-2026
Copyright
© The Author(s) 2026
Publishing License

 This is an Open Access article distributed under the terms of the Creative Commons Attribution (CC BY 4.0) License .